AI-Powered Scheduling & Patient Access Optimization Dashboard

Overview
Built an AI-assisted scheduling dashboard in Power BI that identifies hospital bottlenecks, forecasts patient demand, and recommends operational improvements. Analyzed 25K appointment records, used AI visuals for driver analysis, and delivered a decision-ready tool that highlights delay risks, utilization gaps, and actionable optimization strategies.
What I Did
- Defined the business objective, metric targets, and analysis scope.
- Built and validated the data, modeling, and reporting workflow.
- Packaged outputs for stakeholder interpretation and decision support.
Results/Impact
Delivered an analysis workflow with decision-ready outputs and reusable artifacts.
Tech Stack
- AI, Forecasting, Operational Efficiency, PowerBI
Deliverables
Project Notes
Description: Built an AI-assisted scheduling dashboard in Power BI that identifies hospital bottlenecks, forecasts patient demand, and recommends operational improvements. Analyzed 25K appointment records, used AI visuals for driver analysis, and delivered a decision-ready tool that highlights delay risks, utilization gaps, and actionable optimization strategies. Skills Demonstrated: AI, Forecasting, Operational Efficiency, PowerBI Project Status: Planning
Overview
An interactive Power BI dashboard that uses AI-assisted analytics to identify scheduling bottlenecks, forecast patient demand, and recommend optimization strategies for hospital departments.
Built with Copilot integration, this project simulates how healthcare systems can apply data science and automation to improve patient access and operational efficiency.
Objectives
- Analyze department-level wait times, no-show rates, and utilization trends.
- Use AI forecasting to project future appointment volume.
- Identify key factors driving scheduling delays through Key Influencers analysis.
- Generate automated Copilot recommendations for operational improvement.
Tools & Skills Used
| Category | Details |
|---|---|
| Tools | Power BI, Copilot Pro, Excel (for synthetic data prep) |
| Techniques | Data modeling, DAX calculations, Key Influencers & Decomposition Tree, forecasting models |
| AI Components | Power BI Copilot + built-in AI visuals |
| Data Size | 25,000 synthetic appointment records |
| Key Metrics | Wait time (minutes), no-show rate (%), utilization (%), lead time (days) |
Dashboard Design
Page 1 - Access Overview Dashboard: Operational Summary
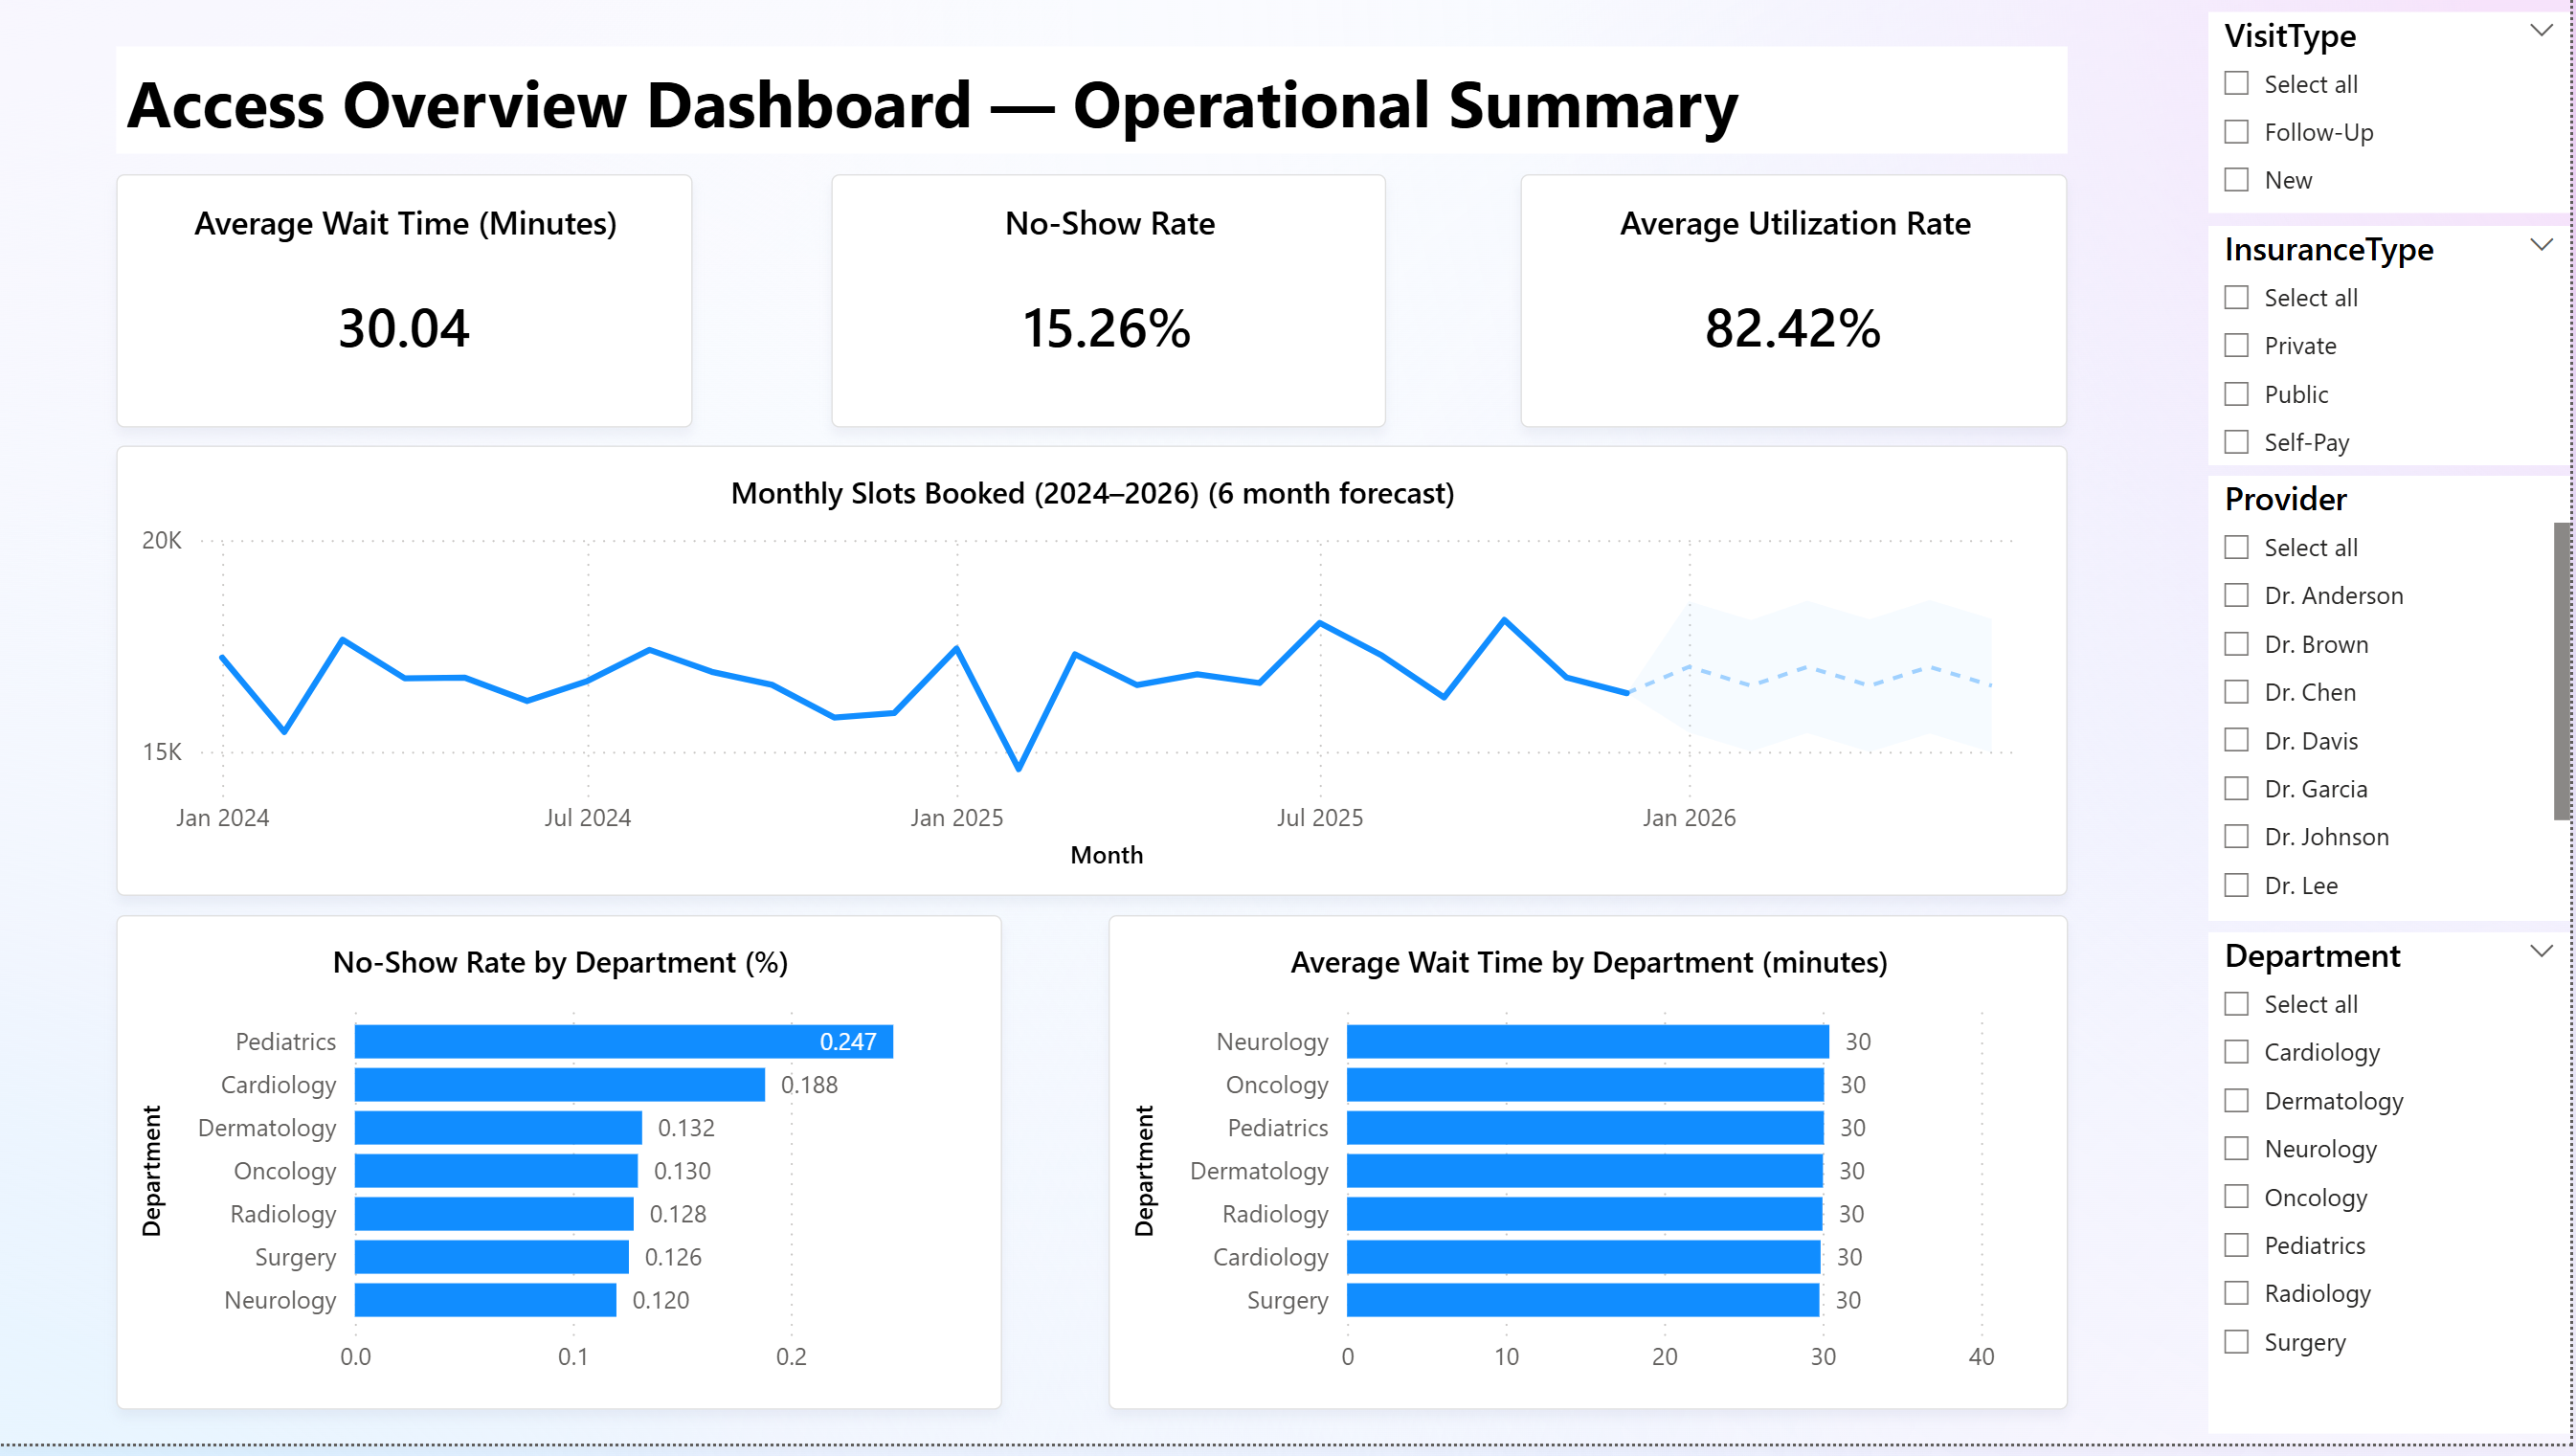
Purpose: Provide a high-level overview of scheduling performance.
Key Features:
- KPI Cards: Average wait time, no-show rate, and utilization rate.
- Forecast Chart: 6-month projection of appointment demand with AI forecasting.
- Bottleneck Analysis: Department-level comparison of wait time and no-show rate.
- Dynamic Slicers: Filter by department, provider, insurance type, visit type, and telehealth.
Insight Example:
Pediatrics and Cardiology departments show higher no-show rates, while Self-Pay patients experience longer scheduling delays.
Page 2 - AI-Driven Scheduling Insights & Optimization Scenarios
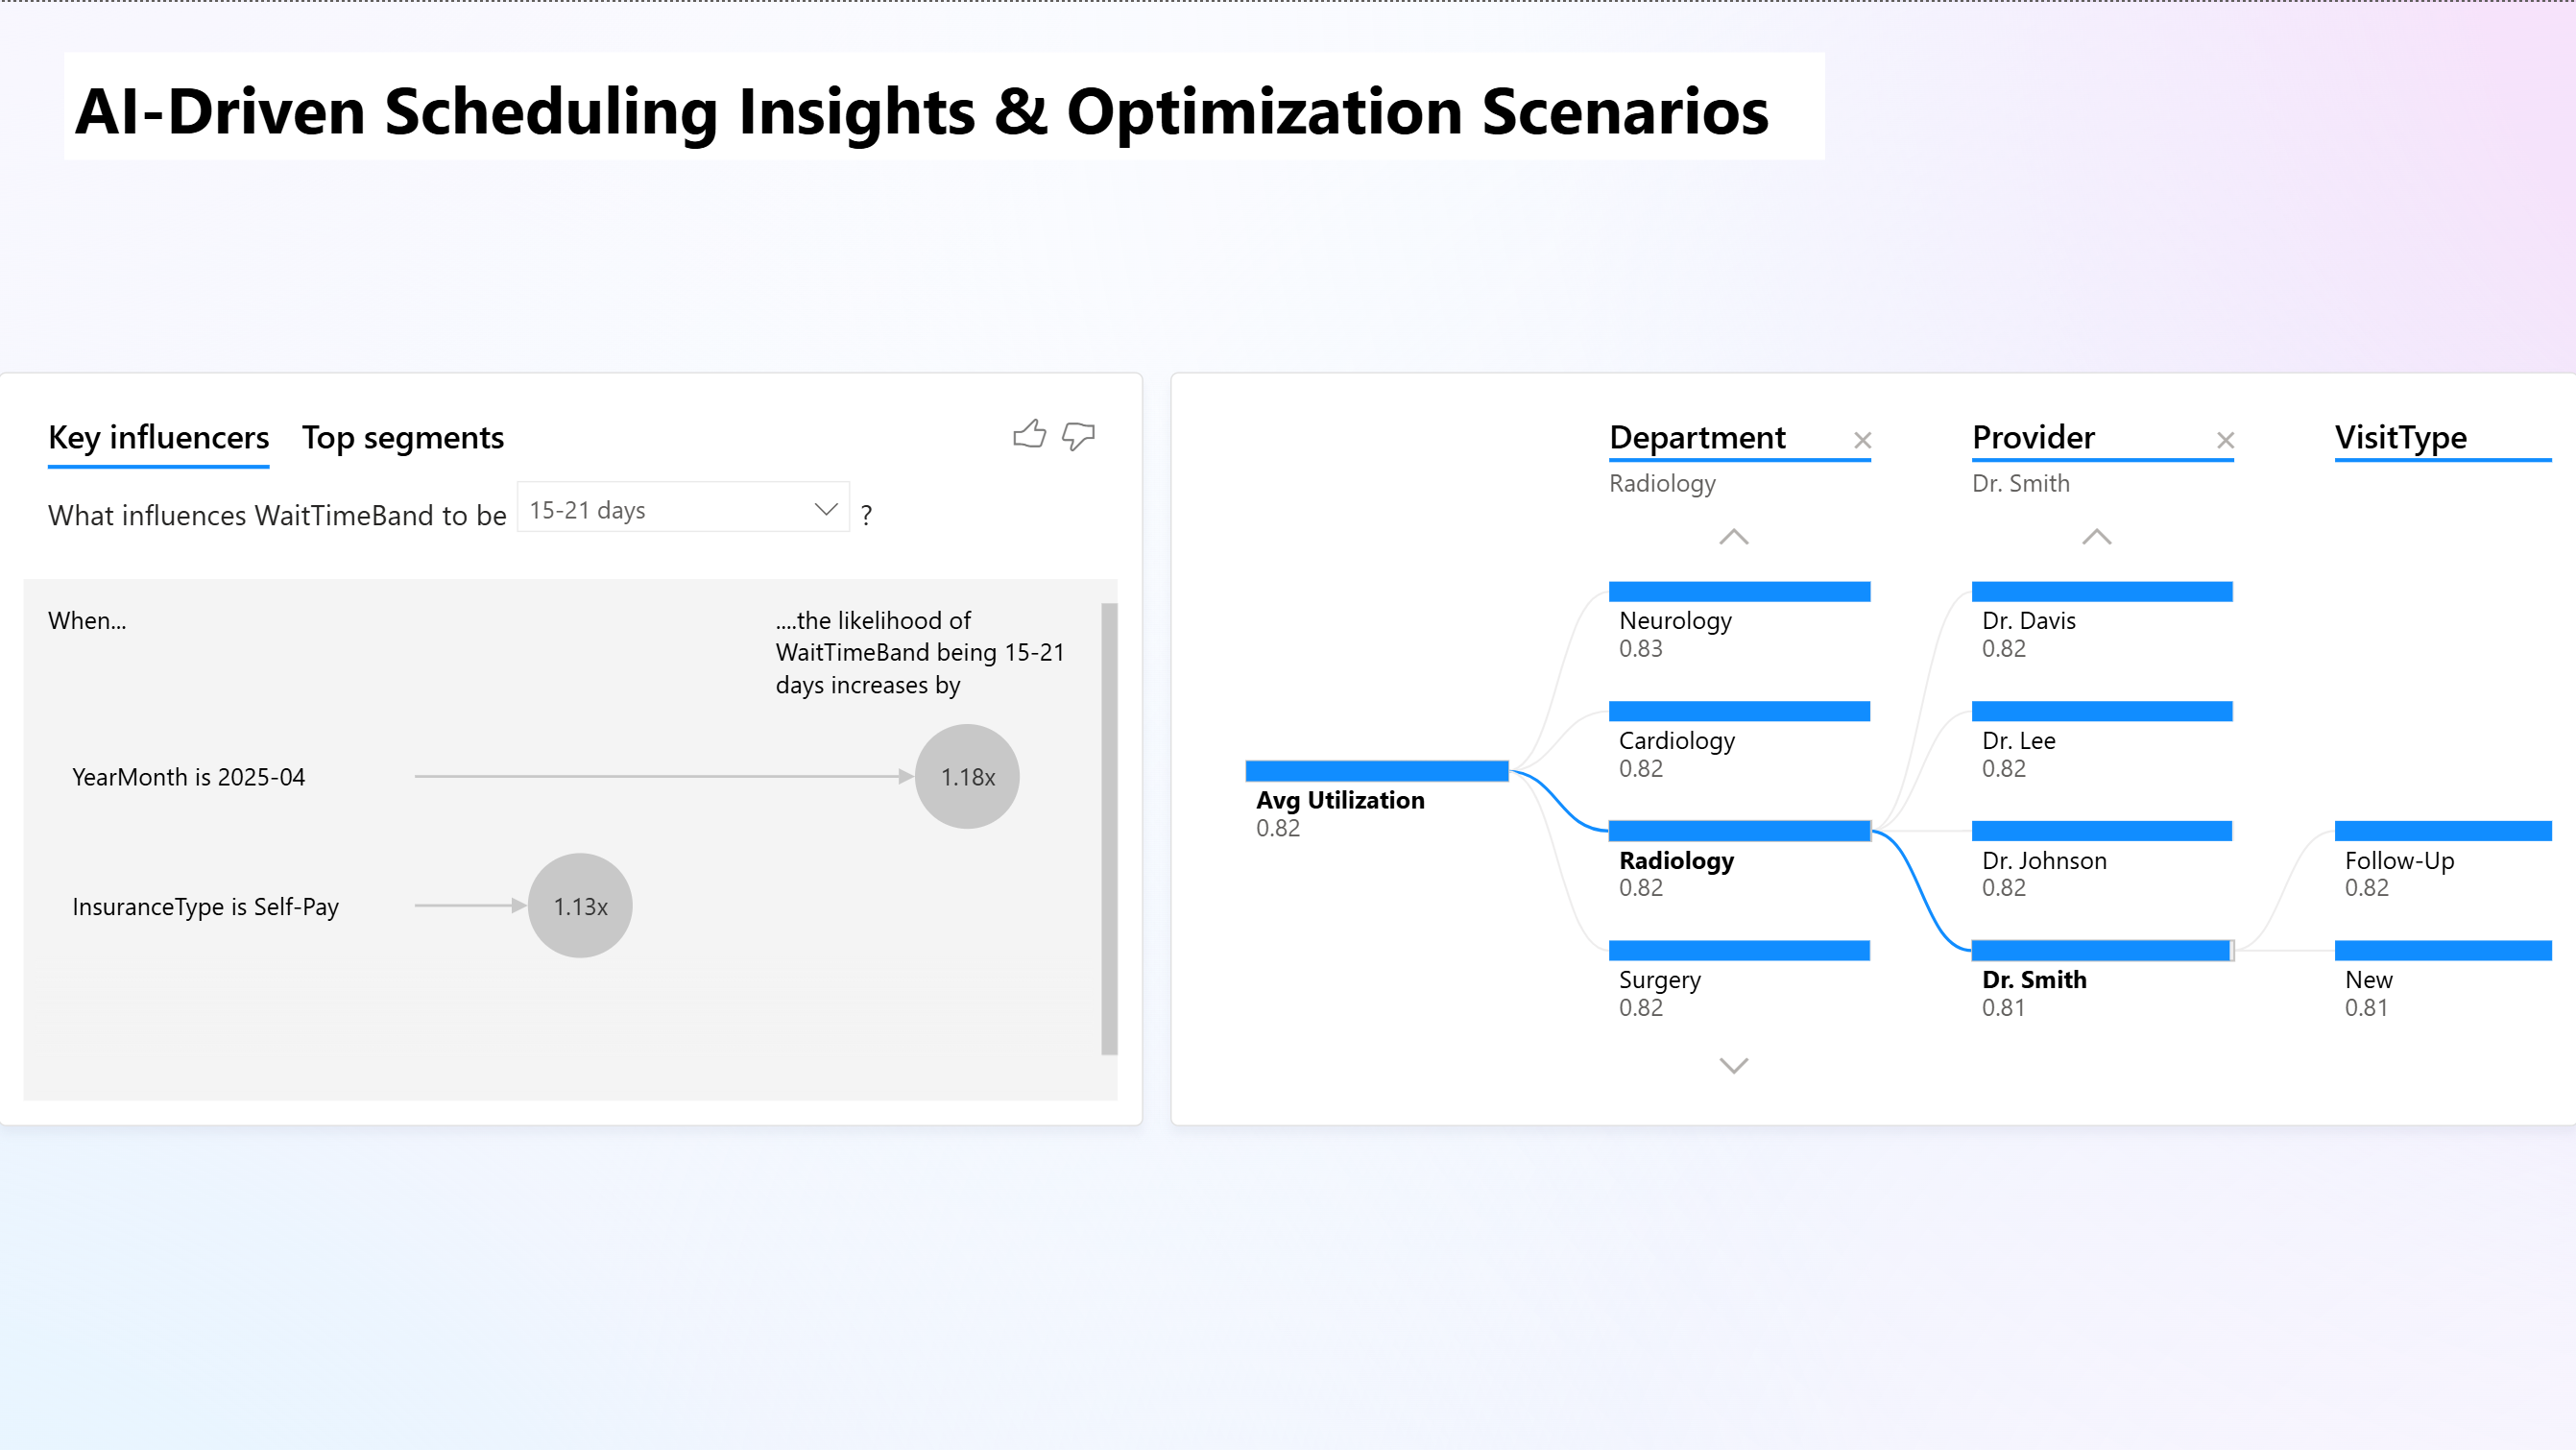
Purpose: Explore -why- delays happen and -how- to improve scheduling efficiency.
Key Features:
- Key Influencers Visual: Reveals that Self-Pay patients and April appointments increase the likelihood of 15-21-day waits by 13-18%.
- Decomposition Tree: Explores utilization patterns by Department - Provider - Visit Type.
- AI Narrative Section: Copilot summarizes insights and suggests process improvements.
Copilot-Generated Example Insight:
-Telehealth appointments reduce average wait times by 1.6 days. Self-Pay segments show 13% higher delay risk. Recommend prioritizing Q2 Telehealth capacity for Pediatrics and automating Self-Pay verification workflows.-
Dataset Summary
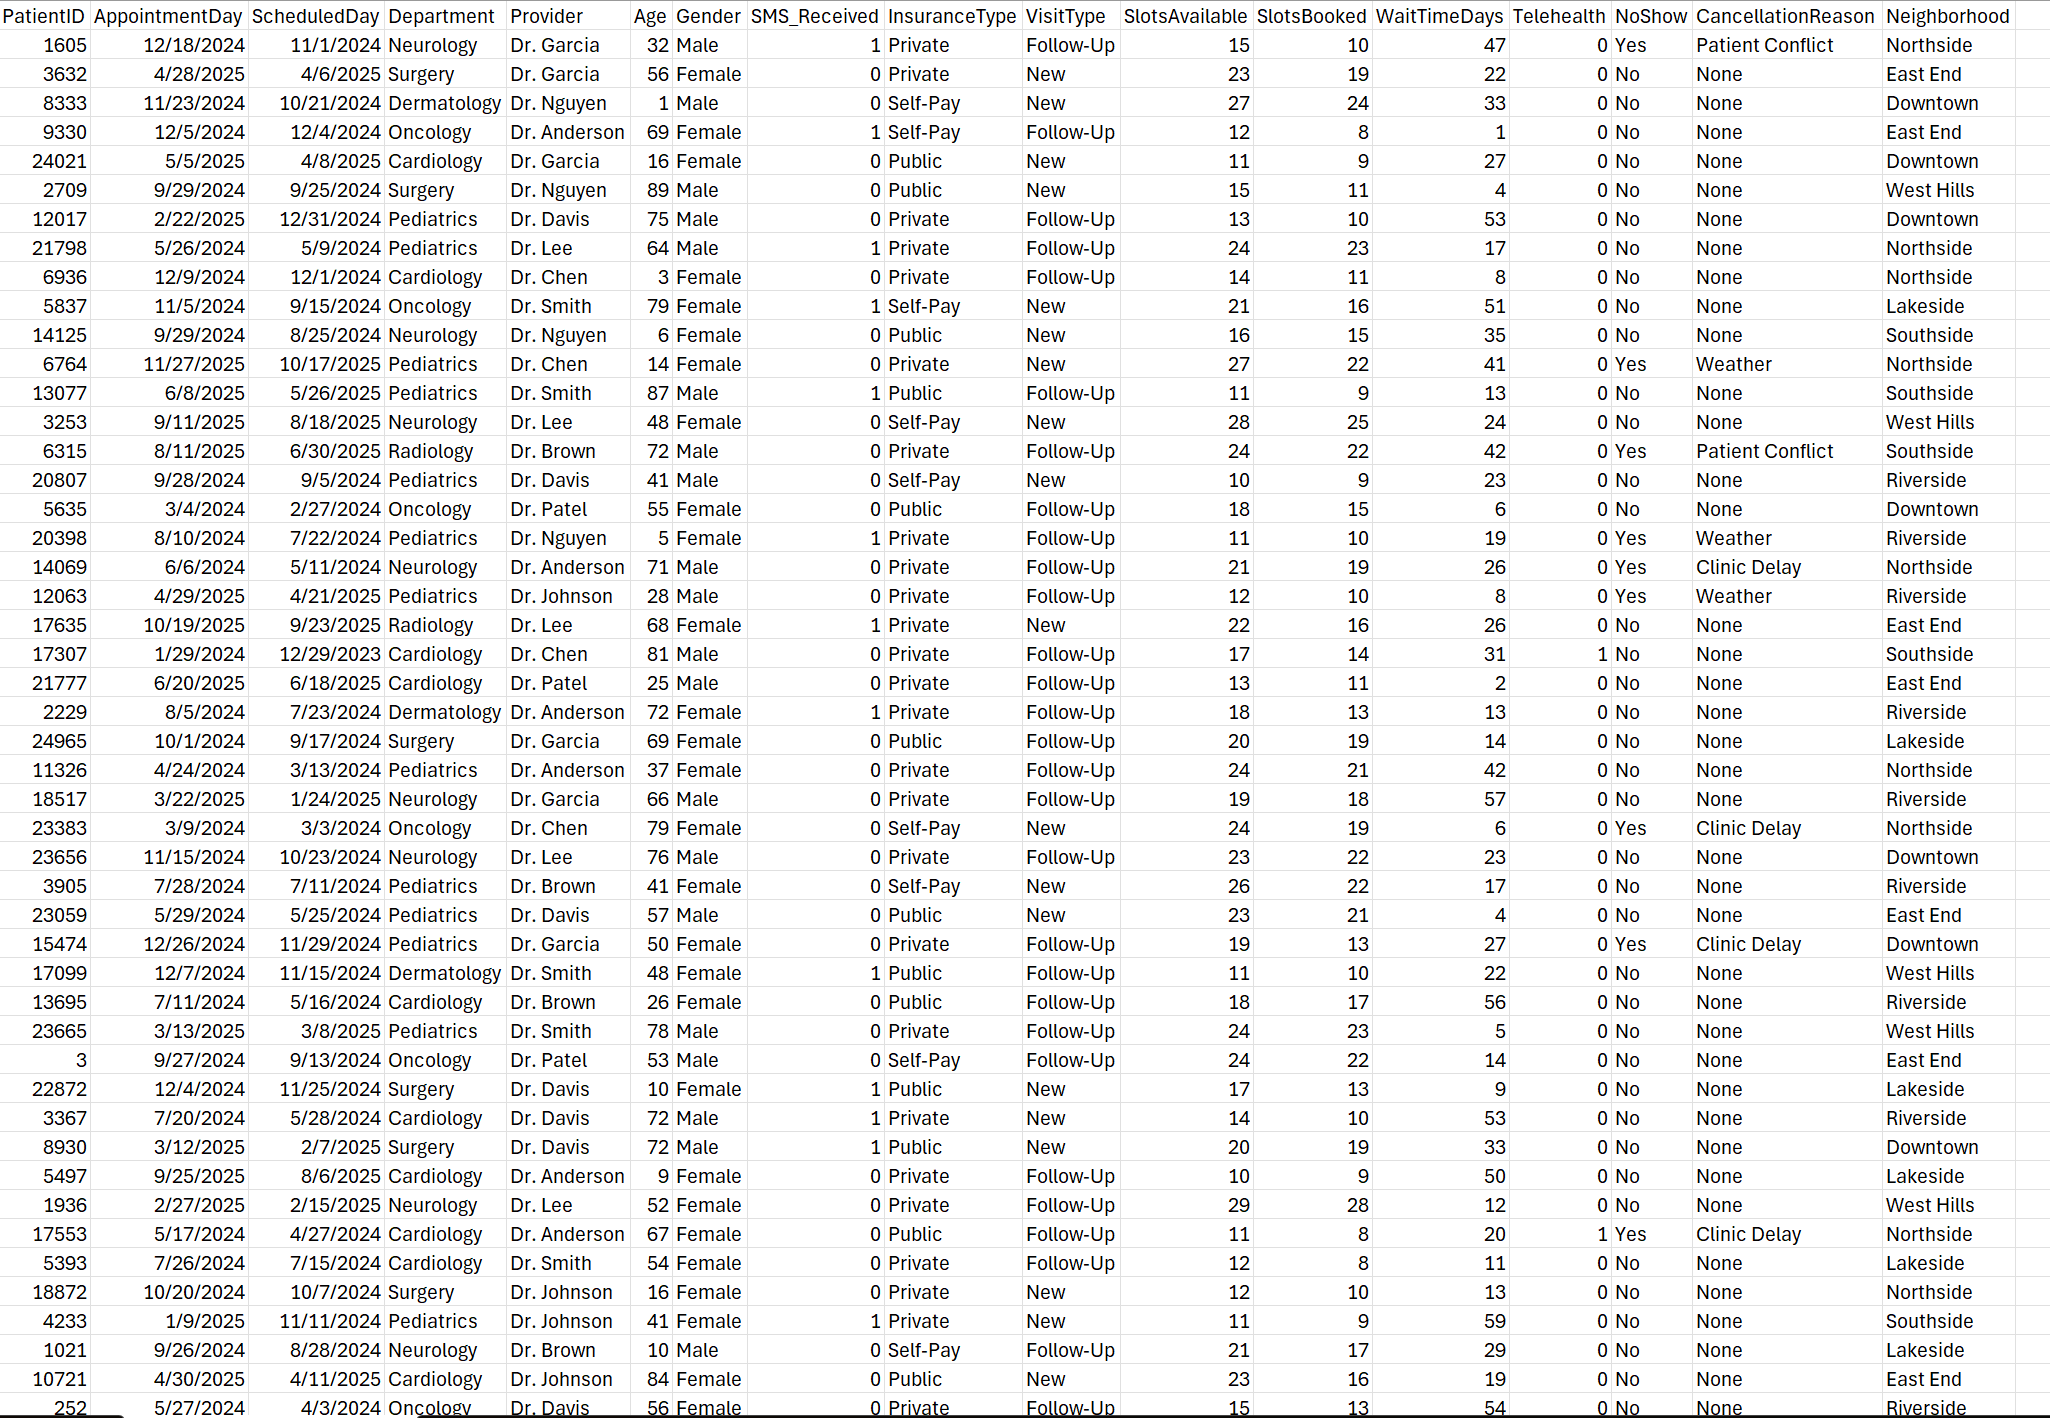
Synthetic dataset generated to simulate realistic hospital scheduling data with:
- 25,000 rows across Departments, Providers, Insurance types, and Visit types.
- Variables: Appointment day, slots booked, slots available, wait time (days), no-show flag, utilization ratio, telehealth status, and payer type.
- Derived Columns: Utilization %, Wait Time Band (for Key Influencers), Year-Month.
Technical Highlights
- Created calculated columns using DAX:
Utilization = SlotsBooked / SlotsAvailableWaitTimeBandfor categorical AI analysis.
- Configured AI Forecast to predict 3-month future booking trends.
- Leveraged Copilot to produce narrative insights and optimization strategies.
Key Outcomes
| Goal | Result |
|---|---|
| Forecast patient demand | Achieved 6-month forward projection with confidence interval |
| Identify bottlenecks | Highlighted Self-Pay and Pediatrics as delay drivers |
| Integrate AI decision support | Generated Copilot recommendations for resource reallocation |
| Create executive-ready visuals | Two-page Power BI design with interactive slicers and KPIs |
Deliverables
Hospital Operations Efficiency Dashboard.pbix
Hospital_Scheduling_AI_25K.csv
Hospital Efficiency Report.pdf
Reflection
This project pushed me to combine healthcare analytics with AI-assisted business intelligence. Instead of only tracking metrics, I built a dashboard that thinks - so forecasting demand, uncovering patterns, and recommending real actions.
Attribution
Designed and developed by Markuss Saule.