flowchart TD
A["CSV (Kaggle)"] --> B["MySQL: staging_encounter_raw"]
B --> C["MySQL: normalized tables"]
C --> D["SQL view: vw_encounter_patient"]
D --> E["R: cleaning & fairness"]
E --> F["Power BI: dashboard"]
E --> G["Exports (CSV / MySQL tables)"]
Hospital Readmission Analytics (SQL + R + Power BI)
Overview
Built a full readmission analytics pipeline using SQL, R, and Power BI on 100K+ hospital encounters. Designed a normalized SQL schema, engineered an analysis view, and ran statistical modeling in R to identify what drives 30-day readmissions. Found an overall readmission rate of ~11%, modest subgroup gaps (~2.7%), and clear clinical drivers: length of stay, number of diagnoses, and medication count. Delivered a 3-page Power BI report showing equity metrics, risk patterns, and clinical complexity signals.
What I Did
- Defined the business objective, metric targets, and analysis scope.
- Built and validated the data, modeling, and reporting workflow.
- Packaged outputs for stakeholder interpretation and decision support.
Results/Impact
Delivered an analysis workflow with decision-ready outputs and reusable artifacts.
Tech Stack
- Data Analysis, Database Management, Problem Solving, Programming, Project Management, UI/UX Design
Deliverables
Project Notes
Description: Built a full readmission analytics pipeline using SQL, R, and Power BI on 100K+ hospital encounters. Designed a normalized SQL schema, engineered an analysis view, and ran statistical modeling in R to identify what drives 30-day readmissions. Found an overall readmission rate of ~11%, modest subgroup gaps (~2.7%), and clear clinical drivers: length of stay, number of diagnoses, and medication count. Delivered a 3-page Power BI report showing equity metrics, risk patterns, and clinical complexity signals. Skills Demonstrated: Data Analysis, Database Management, Problem Solving, Programming, Project Management, UI/UX Design Project Status: Completed Completion Date: September 16, 2025
Executive Summary
I-ve wanted to find ways to use my skills to contribute to healthcare. This made me think even more about how data and analytics could support doctors, patients, and families.
So, I picked up the Diabetes 130-US Hospitals dataset (about 100,000 encounters from 1999-2008) and built a full pipeline using SQL, R, and Power BI. My goal was to take messy data and turn it into something clear and useful: a story about which patients are most likely to be readmitted within 30 days, and why.
What I found:
- About 11% of patients are readmitted within 30 days.
- There-s a small but real 2.7% gap between the lowest and highest racial subgroups.
- The biggest drivers of risk are number of diagnoses, how many medications are prescribed, and how long the patient stays in the hospital.
This was both a technical challenge and a personal project. It was proof that I can design an end-to-end workflow while keeping the focus on people represented in the dataset.
Data & Tools
- Dataset: Diabetes 130-US Hospitals (~100k encounters)
- Tools: MySQL, R (Quarto), Power BI
- Exports: Cleaned CSVs and visuals for BI
Methods
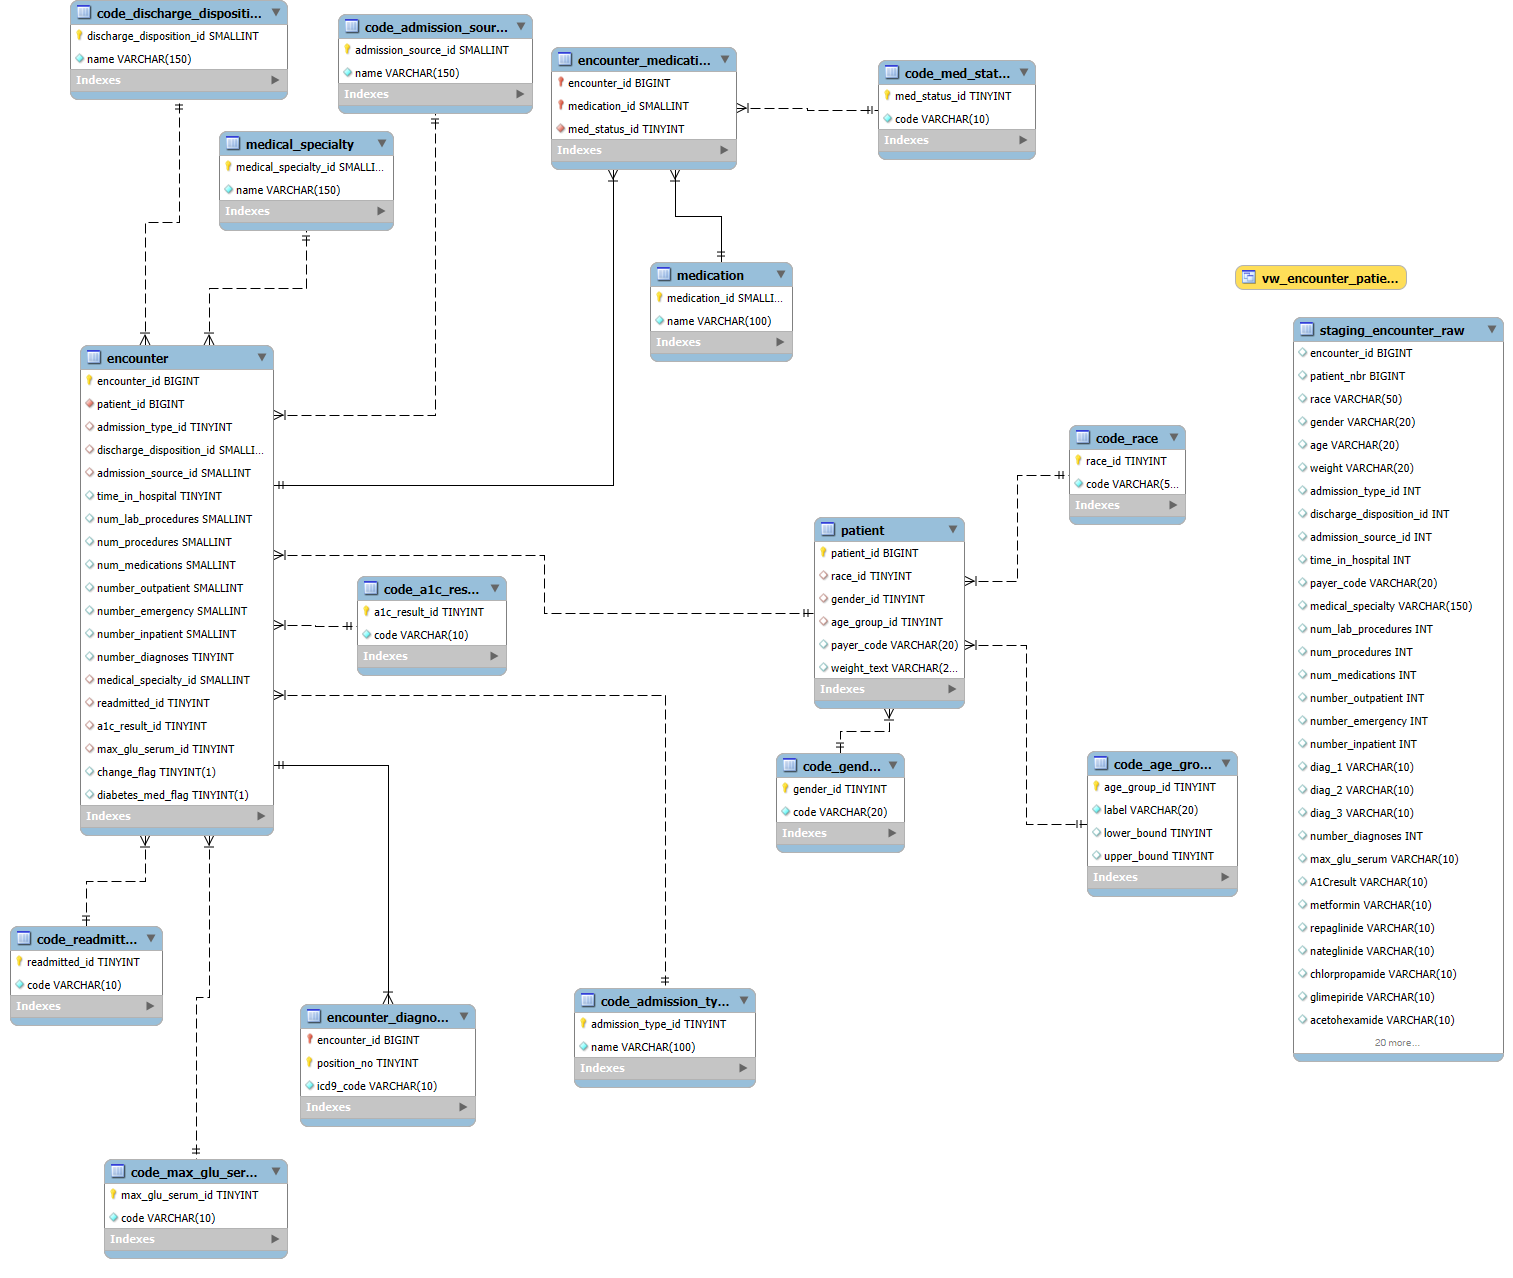
SQL (data foundation)
I built a normalized schema in MySQL to handle patients, encounters, diagnoses, and medications. A staging table pulled in the raw CSV, then I cleaned and mapped the categories (race, gender, readmission flags, A1C, glucose levels). From there I created a single analysis view that was easy to query later in R and Power BI.

SQL Code & Comments
-- ==========================================================
-- Hospital Readmission Database (Diabetes 130-US Hospitals)
-- Author: Markuss Saule
-- ==========================================================
-- Purpose:
--   Normalized schema + pipeline for loading and analyzing
--   ~100k encounters from the Diabetes 130-US Hospitals dataset.
-- Steps:
--   0) Create database
--   1) Reference (code) tables
--   2) Core entity tables
--   3) Staging table (mirror CSV)
--   4) ETL inserts into normalized schema
--   5) Basic validation queries
--   6) Analysis view
-- ==========================================================

-- 0) Create database
CREATE DATABASE IF NOT EXISTS diabetes_db
CHARACTER SET utf8mb4 COLLATE utf8mb4_0900_ai_ci;
USE diabetes_db;

-- ==========================================================
-- 1) Reference (code) tables
-- ==========================================================
CREATE TABLE code_race (
race_id TINYINT UNSIGNED PRIMARY KEY AUTO_INCREMENT,
code    VARCHAR(50) NOT NULL UNIQUE
);

CREATE TABLE code_gender (
gender_id TINYINT UNSIGNED PRIMARY KEY AUTO_INCREMENT,
code      VARCHAR(20) NOT NULL UNIQUE
);

CREATE TABLE code_age_group (
age_group_id TINYINT UNSIGNED PRIMARY KEY AUTO_INCREMENT,
label        VARCHAR(20) NOT NULL UNIQUE,
lower_bound  TINYINT NULL,
upper_bound  TINYINT NULL
);

CREATE TABLE code_admission_type (
admission_type_id TINYINT UNSIGNED PRIMARY KEY,
name              VARCHAR(100) NOT NULL UNIQUE
);

CREATE TABLE code_discharge_disposition (
discharge_disposition_id SMALLINT UNSIGNED PRIMARY KEY,
name                     VARCHAR(150) NOT NULL UNIQUE
);

CREATE TABLE code_admission_source (
admission_source_id SMALLINT UNSIGNED PRIMARY KEY,
name                VARCHAR(150) NOT NULL UNIQUE
);

CREATE TABLE code_readmitted (
readmitted_id TINYINT UNSIGNED PRIMARY KEY AUTO_INCREMENT,
code          VARCHAR(10) NOT NULL UNIQUE  -- '<30', '>30', 'NO'
);

CREATE TABLE code_a1c_result (
a1c_result_id TINYINT UNSIGNED PRIMARY KEY AUTO_INCREMENT,
code          VARCHAR(10) NOT NULL UNIQUE
);

CREATE TABLE code_max_glu_serum (
max_glu_serum_id TINYINT UNSIGNED PRIMARY KEY AUTO_INCREMENT,
code             VARCHAR(10) NOT NULL UNIQUE
);

CREATE TABLE medical_specialty (
medical_specialty_id SMALLINT UNSIGNED PRIMARY KEY AUTO_INCREMENT,
name                 VARCHAR(150) NOT NULL UNIQUE
);

CREATE TABLE medication (
medication_id SMALLINT UNSIGNED PRIMARY KEY AUTO_INCREMENT,
name          VARCHAR(100) NOT NULL UNIQUE
);

CREATE TABLE code_med_status (
med_status_id TINYINT UNSIGNED PRIMARY KEY AUTO_INCREMENT,
code          VARCHAR(10) NOT NULL UNIQUE   -- 'No', 'Steady', 'Up', 'Down'
);

-- ==========================================================
-- 2) Core entity tables
-- ==========================================================
CREATE TABLE patient (
patient_id   BIGINT PRIMARY KEY,          -- from CSV patient_nbr
race_id      TINYINT UNSIGNED NULL,
gender_id    TINYINT UNSIGNED NULL,
age_group_id TINYINT UNSIGNED NULL,
payer_code   VARCHAR(20) NULL,
weight_text  VARCHAR(20) NULL,
CONSTRAINT fk_patient_race    FOREIGN KEY (race_id) REFERENCES code_race(race_id),
CONSTRAINT fk_patient_gender  FOREIGN KEY (gender_id) REFERENCES code_gender(gender_id),
CONSTRAINT fk_patient_agegrp  FOREIGN KEY (age_group_id) REFERENCES code_age_group(age_group_id)
);

CREATE TABLE encounter (
encounter_id             BIGINT PRIMARY KEY, -- from CSV
patient_id               BIGINT NOT NULL,
admission_type_id        TINYINT UNSIGNED NULL,
discharge_disposition_id SMALLINT UNSIGNED NULL,
admission_source_id      SMALLINT UNSIGNED NULL,
time_in_hospital         TINYINT UNSIGNED NULL,
num_lab_procedures       SMALLINT UNSIGNED NULL,
num_procedures           SMALLINT UNSIGNED NULL,
num_medications          SMALLINT UNSIGNED NULL,
number_outpatient        SMALLINT UNSIGNED NULL,
number_emergency         SMALLINT UNSIGNED NULL,
number_inpatient         SMALLINT UNSIGNED NULL,
number_diagnoses         TINYINT UNSIGNED NULL,
medical_specialty_id     SMALLINT UNSIGNED NULL,
readmitted_id            TINYINT UNSIGNED NULL,
a1c_result_id            TINYINT UNSIGNED NULL,
max_glu_serum_id         TINYINT UNSIGNED NULL,
change_flag              BOOLEAN NULL,    -- 'Ch'->true, 'No'->false
diabetes_med_flag        BOOLEAN NULL,    -- 'Yes'/'No'
CONSTRAINT fk_enc_patient     FOREIGN KEY (patient_id) REFERENCES patient(patient_id),
CONSTRAINT fk_enc_admtype     FOREIGN KEY (admission_type_id) REFERENCES code_admission_type(admission_type_id),
CONSTRAINT fk_enc_disposition FOREIGN KEY (discharge_disposition_id) REFERENCES code_discharge_disposition(discharge_disposition_id),
CONSTRAINT fk_enc_admsource   FOREIGN KEY (admission_source_id) REFERENCES code_admission_source(admission_source_id),
CONSTRAINT fk_enc_med_spec    FOREIGN KEY (medical_specialty_id) REFERENCES medical_specialty(medical_specialty_id),
CONSTRAINT fk_enc_readmitted  FOREIGN KEY (readmitted_id) REFERENCES code_readmitted(readmitted_id),
CONSTRAINT fk_enc_a1c         FOREIGN KEY (a1c_result_id) REFERENCES code_a1c_result(a1c_result_id),
CONSTRAINT fk_enc_maxglu      FOREIGN KEY (max_glu_serum_id) REFERENCES code_max_glu_serum(max_glu_serum_id)
);

CREATE TABLE encounter_diagnosis (
encounter_id BIGINT NOT NULL,
position_no  TINYINT UNSIGNED NOT NULL,  -- 1,2,3
icd9_code    VARCHAR(10) NOT NULL,
PRIMARY KEY (encounter_id, position_no),
CONSTRAINT fk_ed_enc FOREIGN KEY (encounter_id) REFERENCES encounter(encounter_id)
);

CREATE TABLE encounter_medication (
encounter_id  BIGINT NOT NULL,
medication_id SMALLINT UNSIGNED NOT NULL,
med_status_id TINYINT UNSIGNED NOT NULL,
PRIMARY KEY (encounter_id, medication_id),
CONSTRAINT fk_em_enc    FOREIGN KEY (encounter_id)  REFERENCES encounter(encounter_id),
CONSTRAINT fk_em_med    FOREIGN KEY (medication_id) REFERENCES medication(medication_id),
CONSTRAINT fk_em_status FOREIGN KEY (med_status_id) REFERENCES code_med_status(med_status_id)
);

-- ==========================================================
-- 3) Staging table (mirror CSV for import)
-- ==========================================================
DROP TABLE IF EXISTS staging_encounter_raw;
CREATE TABLE staging_encounter_raw (
encounter_id    BIGINT,
patient_nbr     BIGINT,
race            VARCHAR(50),
gender          VARCHAR(20),
age             VARCHAR(20),
weight          VARCHAR(20),
admission_type_id INT,
discharge_disposition_id INT,
admission_source_id INT,
time_in_hospital INT,
payer_code      VARCHAR(20),
medical_specialty VARCHAR(150),
num_lab_procedures INT,
num_procedures  INT,
num_medications INT,
number_outpatient INT,
number_emergency INT,
number_inpatient INT,
diag_1          VARCHAR(10),
diag_2          VARCHAR(10),
diag_3          VARCHAR(10),
number_diagnoses INT,
max_glu_serum   VARCHAR(10),
A1Cresult       VARCHAR(10),
metformin       VARCHAR(10),
repaglinide     VARCHAR(10),
nateglinide     VARCHAR(10),
chlorpropamide  VARCHAR(10),
glimepiride     VARCHAR(10),
acetohexamide   VARCHAR(10),
glipizide       VARCHAR(10),
glyburide       VARCHAR(10),
tolbutamide     VARCHAR(10),
pioglitazone    VARCHAR(10),
rosiglitazone   VARCHAR(10),
acarbose        VARCHAR(10),
miglitol        VARCHAR(10),
troglitazone    VARCHAR(10),
tolazamide      VARCHAR(10),
examide         VARCHAR(10),
citoglipton     VARCHAR(10),
insulin         VARCHAR(10),
glyburide_metformin VARCHAR(10),
glipizide_metformin VARCHAR(10),
glimepiride_pioglitazone VARCHAR(10),
metformin_rosiglitazone VARCHAR(10),
metformin_pioglitazone VARCHAR(10),
change_raw      VARCHAR(10),
diabetesMed     VARCHAR(10),
readmitted      VARCHAR(10)
);

-- ==========================================================
-- 4) ETL Inserts
-- ==========================================================

-- Populate reference/code tables
INSERT IGNORE INTO code_race (code)              SELECT DISTINCT race FROM staging_encounter_raw;
INSERT IGNORE INTO code_gender (code)            SELECT DISTINCT gender FROM staging_encounter_raw;
INSERT IGNORE INTO code_age_group (label)        SELECT DISTINCT age FROM staging_encounter_raw;
INSERT IGNORE INTO code_readmitted (code)        SELECT DISTINCT readmitted FROM staging_encounter_raw;
INSERT IGNORE INTO code_a1c_result (code)        SELECT DISTINCT A1Cresult FROM staging_encounter_raw;
INSERT IGNORE INTO code_max_glu_serum (code)     SELECT DISTINCT max_glu_serum FROM staging_encounter_raw;
INSERT IGNORE INTO medical_specialty (name)
SELECT DISTINCT medical_specialty FROM staging_encounter_raw WHERE medical_specialty <> '?';

INSERT IGNORE INTO code_admission_type (admission_type_id, name)
SELECT DISTINCT admission_type_id, CONCAT('Type ', admission_type_id)
FROM staging_encounter_raw WHERE admission_type_id IS NOT NULL;

INSERT IGNORE INTO code_discharge_disposition (discharge_disposition_id, name)
SELECT DISTINCT discharge_disposition_id, CONCAT('Disposition ', discharge_disposition_id)
FROM staging_encounter_raw WHERE discharge_disposition_id IS NOT NULL;

INSERT IGNORE INTO code_admission_source (admission_source_id, name)
SELECT DISTINCT admission_source_id, CONCAT('Source ', admission_source_id)
FROM staging_encounter_raw WHERE admission_source_id IS NOT NULL;

-- Patients
INSERT INTO patient (patient_id, race_id, gender_id, age_group_id, payer_code, weight_text)
SELECT
s.patient_nbr,
r.race_id,
g.gender_id,
a.age_group_id,
NULLIF(s.payer_code, '?'),
NULLIF(s.weight, '?')
FROM (
SELECT s1.*
FROM staging_encounter_raw s1
JOIN (
SELECT patient_nbr, MIN(encounter_id) AS min_enc
FROM staging_encounter_raw
GROUP BY patient_nbr
) t ON s1.patient_nbr = t.patient_nbr AND s1.encounter_id = t.min_enc
) s
LEFT JOIN code_race r ON r.code = s.race
LEFT JOIN code_gender g ON g.code = s.gender
LEFT JOIN code_age_group a ON a.label = s.age;

-- Encounters
INSERT INTO encounter (
encounter_id, patient_id, admission_type_id, discharge_disposition_id, admission_source_id,
time_in_hospital, num_lab_procedures, num_procedures, num_medications,
number_outpatient, number_emergency, number_inpatient, number_diagnoses,
medical_specialty_id, readmitted_id, a1c_result_id, max_glu_serum_id,
change_flag, diabetes_med_flag
)
SELECT
s.encounter_id,
s.patient_nbr,
s.admission_type_id,
s.discharge_disposition_id,
s.admission_source_id,
s.time_in_hospital,
s.num_lab_procedures,
s.num_procedures,
s.num_medications,
s.number_outpatient,
s.number_emergency,
s.number_inpatient,
s.number_diagnoses,
ms.medical_specialty_id,
cr.readmitted_id,
ca.a1c_result_id,
cg.max_glu_serum_id,
CASE WHEN s.change_raw = 'Ch' THEN TRUE WHEN s.change_raw = 'No' THEN FALSE ELSE NULL END,
CASE WHEN s.diabetesMed = 'Yes' THEN TRUE WHEN s.diabetesMed = 'No' THEN FALSE ELSE NULL END
FROM staging_encounter_raw s
LEFT JOIN medical_specialty ms ON [ms.name](http://ms.name/) = s.medical_specialty
LEFT JOIN code_readmitted cr   ON cr.code = s.readmitted
LEFT JOIN code_a1c_result ca   ON ca.code = s.A1Cresult
LEFT JOIN code_max_glu_serum cg ON cg.code = s.max_glu_serum;

-- ==========================================================
-- 5) Validation queries
-- ==========================================================
SELECT COUNT(*) AS n_patients FROM patient;
SELECT COUNT(*) AS n_encounters FROM encounter;

SELECT cr.code AS readmitted, COUNT(*) AS n
FROM encounter e
JOIN code_readmitted cr ON cr.readmitted_id = e.readmitted_id
GROUP BY cr.code;

-- ==========================================================
-- 6) Analysis view
-- ==========================================================
CREATE OR REPLACE VIEW vw_encounter_patient AS
SELECT
e.encounter_id,
p.patient_id,
r.code AS race,
g.code AS gender,
a.label AS age_group,
e.time_in_hospital,
e.num_medications,
e.number_diagnoses,
cr.code AS readmitted
FROM encounter e
JOIN patient p              ON p.patient_id = e.patient_id
LEFT JOIN code_race r       ON r.race_id = p.race_id
LEFT JOIN code_gender g     ON g.gender_id = p.gender_id
LEFT JOIN code_age_group a  ON a.age_group_id = p.age_group_id
LEFT JOIN code_readmitted cr ON cr.readmitted_id = e.readmitted_id;
R (analysis & reporting)
In R, I cleaned the fields, built a binary readmission flag, and ran exploratory analysis. I also built a logistic regression model to test what factors increased risk of readmission. Finally, I exported cleaned tables for Power BI.
Hospital Readmission Equity Report.pdf
R Code & Comments
``` r — title: “Hospital Readmission Equity Report” author: “Markuss Saule” date: “9/15/2025” format: html: theme: cosmo toc: true toc-depth: 3 number-sections: true code-copy: true df-print: paged execute: echo: false warning: false message: false fig-cap-location: bottom code-fold: show jupyter: false —
# Packages
required <- c(
  "DBI","RMariaDB","dplyr","tidyr","forcats","ggplot2",
  "broom","scales","stringr","readr","knitr","kableExtra"
)
to_install <- setdiff(required, rownames(installed.packages()))
if (length(to_install)) install.packages(to_install, quiet = TRUE)
invisible(lapply(required, library, character.only = TRUE))

# Utility theme
theme_set(theme_minimal(base_size = 13))
con <- dbConnect( RMariaDB::MariaDB(), user = "root", password = "x", dbname = "diabetes_db", host = "127.0.0.1", port = 3306 ) # Pull data and clean immediately so summary stats exist for Executive Summary df <- dbGetQuery(con, "SELECT * FROM vw_encounter_patient;") df_clean <- df %>% mutate( race = na_if(race, "Unknown"), race = na_if(race, "?"), gender = ifelse(gender %in% c("Unknown/Invalid","?"), NA, gender), readmit_flag = ifelse(readmitted == "<30", 1, 0), age_mid = dplyr::case_when( str_detect(age_group, "\\[\\d+-\\d+\\)") ~ { lo <- as.numeric(str_extract(age_group, "(?<=\\[)\\d+")) hi <- as.numeric(str_extract(age_group, "(?<=-)\\d+(?=\\))")) (lo + hi) / 2 }, str_detect(age_group, "\\[\\d+\\+\\)") ~ as.numeric(str_extract(age_group, "\\d+")), TRUE ~ NA_real_ ) ) # Precompute metrics overall_rate_text <- scales::percent(mean(df_clean$readmit_flag, na.rm = TRUE)) subgroup <- df_clean %>% group_by(race) %>% summarise(rate = mean(readmit_flag, na.rm = TRUE), .groups="drop") highest_subgroup_text <- paste0(subgroup$race[which.max(subgroup$rate)], " - ", scales::percent(max(subgroup$rate, na.rm = TRUE))) gap_text <- scales::percent(max(subgroup$rate,na.rm=TRUE) - min(subgroup$rate,na.rm=TRUE))# Executive Summary
This analysis explores 30-day readmission patterns using the public Diabetes 130-US hospitals (1999-2008) dataset.
Key messages:
- The overall 30-day readmission rate is about 11%, consistent with prior analyses of this dataset.
- Race subgroup differences are modest (roughly 9-12%), with overlapping confidence intervals, suggesting no strong racial disparities.
- Gender shows almost no difference in readmission.
- The strongest predictors of readmission are clinical complexity: more diagnoses, longer hospital stays, and greater medication use.
Interpretation note: This dataset is dated and illustrative; findings highlight workflow and methodology, not clinical advice.
This analysis explores 30-day readmission patterns using the public Diabetes 130-US hospitals (1999-2008) dataset, focusing on equity across demographic subgroups and interpretable drivers of risk.
- Overall 30-day readmission rate:
r overall_rate_text
- Demographics not significant: Race and gender coefficients are near 1 with overlapping CIs.
- Clinical complexity matters: Longer stays, more diagnoses, and higher medication counts increase odds of readmission.
- Highest subgroup rate (race):
r highest_subgroup_text
- Gap vs lowest subgroup:
r gap_text
- Key signals: time in hospital, number of diagnoses, and medication intensity show monotonic associations with readmission.
Interpretation note: This is an educational analysis on a public dataset; results are illustrative, not clinical guidance.
# Data & Methods
We implement a pragmatic analytics pipeline similar to what health systems use:
**Outcome**: `readmitted` recoded as **`readmit_flag = 1`** if `"<30"`, else **0**.
**Equity**: subgroup rates and 95% CIs via normal approximation.
**Model**: logistic regression (simple, interpretable).

# Exploratory Overview

```{.text}
n_encounters <- nrow(df_clean)
overall_rate <- mean(df_clean$readmit_flag, na.rm=TRUE)

t_overview <- tibble(
  Metric = c("Encounters", "Overall 30-day readmission rate"),
  Value  = c(scales::comma(n_encounters), scales::percent(overall_rate))
)

knitr::kable(t_overview, caption = "Overall snapshot") %>%
  kableExtra::kable_styling(full_width = FALSE)
```

# Readmission by Race (Equity Perspective)

```{.text}
subgroup <- df_clean %>%
  group_by(race) %>%
  summarise(
    n = dplyr::n(),
    rate = mean(readmit_flag, na.rm = TRUE),
    se = sqrt(rate * (1 - rate) / n),
    lcl = pmax(0, rate - 1.96 * se),
    ucl = pmin(1, rate + 1.96 * se),
    .groups = "drop"
  ) %>%
  arrange(desc(rate))

knitr::kable(subgroup %>%
               mutate(across(c(rate,lcl,ucl), scales::percent)),
             caption = "Readmission by race with 95% CI") %>%
  kableExtra::kable_styling(full_width = FALSE)
```

```{.text}
ggplot(subgroup, aes(x = reorder(race, rate), y = rate, fill = rate)) +
  geom_col() +
  geom_errorbar(aes(ymin = lcl, ymax = ucl), width = 0.2) +
  geom_text(aes(label = scales::percent(rate, accuracy=0.1)), hjust=-0.1, size=3.5) +
  coord_flip() +
  scale_fill_viridis_c(option = 'plasma') +
  scale_y_continuous(labels = scales::percent, expand = expansion(mult = c(0,0.1))) +
  labs(
    title = "30-day readmission rate by race",
    x = NULL, y = "Rate (95% CI)"
  )
```

# Readmission by Gender

```{.text}
by_gender <- df_clean %>%
  filter(!is.na(gender)) %>%
  group_by(gender) %>%
  summarise(
    n = n(),
    rate = mean(readmit_flag, na.rm = TRUE),
    .groups = "drop"
  )

ggplot(by_gender, aes(x = gender, y = rate, fill = gender)) +
  geom_col() +
  geom_text(aes(label = scales::percent(rate, accuracy=0.1)), vjust=-0.5, size=3.5) +
  scale_fill_viridis_d(option = 'plasma') +
  scale_y_continuous(labels = scales::percent, expand = expansion(mult = c(0,0.1))) +
  labs(title = "30-day readmission by gender", x = NULL, y = "Rate")
```

# Logistic Regression (Interpretable Model)

```{.text}
df_model <- df_clean %>%
  filter(!is.na(race), !race %in% c("Unknown"),
         !is.na(gender), !gender %in% c("Unknown")) %>%
  transmute(
    readmit_flag = readmit_flag,
    race   = fct_lump_n(factor(race), n = 5),
    gender = factor(gender),
    age_mid = age_mid,
    time_in_hospital = time_in_hospital,
    num_medications = num_medications,
    number_diagnoses = number_diagnoses
  ) %>%
  drop_na()

m <- glm(
  readmit_flag ~ race + gender + age_mid + time_in_hospital +
    num_medications + number_diagnoses,
  data = df_model, family = binomial()
)

or <- broom::tidy(m, conf.int = TRUE, exponentiate = TRUE) %>%
  mutate(term = str_replace_all(term, "race|gender", ""))

knitr::kable(or %>%
               transmute(Feature = term,
                         `Odds Ratio` = round(estimate, 3),
                         `95% CI (low)` = round(conf.low, 3),
                         `95% CI (high)` = round(conf.high, 3)),
             caption = "Logistic regression (odds ratios)") %>%
  kableExtra::kable_styling(full_width = FALSE)
```

```{.text}
or %>%
  filter(term != "(Intercept)") %>%
  mutate(highlight = ifelse(term %in% c("time_in_hospital","num_medications","number_diagnoses"),
                            "Clinical","Other")) %>%
  ggplot(aes(x = reorder(term, estimate), y = estimate, color = highlight)) +
  geom_point(size=3) +
  geom_errorbar(aes(ymin = conf.low, ymax = conf.high), width = 0.15) +
  coord_flip() +
  geom_hline(yintercept = 1, linetype = 2) +
  scale_color_manual(values = c("Clinical" = "red", "Other" = "black")) +
  scale_y_continuous(limits = c(0.8, 1.2), labels = scales::number_format(accuracy=0.01)) +
  labs(title = "Feature effects (odds ratios with 95% CI)",
       x = NULL, y = "Odds Ratio (Readmission <30 days)")
```

# Exports for Power BI

```{.text}
subgroup_out <- subgroup %>%
  mutate(
    rate = round(rate, 4),
    lcl  = round(lcl, 4),
    ucl  = round(ucl, 4)
  )

enc_slim <- df_clean %>%
  select(encounter_id, patient_id, race, gender, age_group,
         time_in_hospital, num_medications, number_diagnoses,
         readmitted, readmit_flag)

# Write files (for Power BI import)
dir.create("diabetes_project/data/processed", recursive = TRUE, showWarnings = FALSE)
readr::write_csv(subgroup_out, "diabetes_project/data/processed/subgroup_equity.csv")
readr::write_csv(enc_slim,     "diabetes_project/data/processed/encounter_slim.csv")

# Show small previews in report
knitr::kable(head(subgroup_out, 10), caption = "Preview: Subgroup Equity Export") %>%
  kableExtra::kable_styling(full_width = FALSE)

knitr::kable(head(enc_slim, 10), caption = "Preview: Encounter Slim Export") %>%
  kableExtra::kable_styling(full_width = FALSE)
```

# Findings & Interpretation

- **Demographic predictors (race, gender) were not statistically significant** after adjustment; odds ratios were ~1 with overlapping 95% CIs.
- **Clinical complexity** (time in hospital, number of diagnoses, medication count) showed positive, statistically significant associations with readmission.

**Summary of results:**
- The **overall readmission rate is ~11%**.
- **Race subgroup rates range from ~9% to 12%**, with overlapping CIs - differences are modest and not clearly significant.
- **Gender rates are nearly identical.**
- Logistic regression confirms that **clinical complexity (time in hospital, number of diagnoses, medications)**, not demographics, drives readmission risk.

- Overall 30-day readmission rate: **` r overall_rate_text`**
- Highest subgroup (race): **` r highest_subgroup_text`**
- Gap vs lowest subgroup: **` r gap_text`**
- Strongest predictors: **time in hospital**, **number of diagnoses**, **medication burden**.

> **Note:** These are illustrative only, not clinical recommendations.

# Limitations

- Dataset covers 1999-2008, and may not reflect today-s clinical practices.
- Subgroup labels are limited; race/ethnicity categories are coarse.
- Readmission coding may not align with modern standards.

# Next Steps

1. Add A1C & glucose metrics to models.
2. Build risk-adjusted fairness metrics.
3. Export dashboard-ready tables with subgroup CIs.
4. Explore oncology datasets to connect personal mission to Mayo-s work.

# Appendix

## SQL: Analysis View

```sql
CREATE OR REPLACE VIEW vw_encounter_patient AS
SELECT
  e.encounter_id,
  p.patient_id,
  r.code AS race,
  g.code AS gender,
  a.label AS age_group,
  e.time_in_hospital,
  e.num_medications,
  e.number_diagnoses,
  cr.code AS readmitted
FROM encounter e
JOIN patient p              ON p.patient_id = e.patient_id
LEFT JOIN code_race r       ON r.race_id = p.race_id
LEFT JOIN code_gender g     ON g.gender_id = p.gender_id
LEFT JOIN code_age_group a  ON a.age_group_id = p.age_group_id
LEFT JOIN code_readmitted cr ON cr.readmitted_id = e.readmitted_id;
```

## Session Info

```{.text}
sessionInfo()
dbDisconnect(con)
```
```
Power BI (storytelling)
I built a three-page dashboard:
- Overview - overall rate and age breakdown.
- Equity Perspective - racial disparities, with confidence intervals and a simple gap metric.
- Clinical Drivers - scatterplots and charts showing how diagnoses, medications, and length of stay affect readmission.
Dashboard Snapshots
Page 1 - Overview
- 11.2% overall readmission rate.
- Patients in their 20s and 30s have the highest risk (~13.8%).
Page 2 - Equity Spotlight
- Race gap of ~2.7% between lowest and highest subgroup.
- Most groups fall between 10-12%.
Page 3 - Clinical Drivers
- Patients with 7+ diagnoses, or 12+ medications, face ~13-15% readmission.
- Staying in the hospital longer (7+ days) is also linked to higher risk.
Key Insights
- The overall readmission rate is 11%, in line with national numbers.
- Race gaps exist but are not as large as I expected (still worth attention).
- Complexity (more diagnoses, more meds, longer stays) - drives risk far more than demographics.
Reflections & Next Steps
This project reminded me that behind every row in a dataset is a person and a family. I-d explore predictive modeling - not just describing risk, but actually helping hospitals flag patients early.
For me, this wasn-t just about SQL queries and charts. It was about proving to myself that I can take raw data, clean it, analyze it, and tell a story that actually matters.
Downloads
Hospital Readmission Equity Report.pdf
Disclaimer
This project is based on a public dataset and is for educational purposes only.