Fulfillment Center Risk Simulation & Staffing Optimization (Python + SimPy + Power BI)
Overview
Built a discrete-event simulation of a fulfillment center in Python using SimPy to model order flow, queues, utilization, SLA breaches, and WIP under normal and Prime Day-level demand. Implemented minute-level observability, real-time alert detection, station-level pressure scoring, and a multi-factor operational risk model. Ran an exhaustive staffing grid search to identify the minimum headcount required to reduce risk below target thresholds, then surfaced results through a 4-page Power BI dashboard for decision-ready staffing and risk mitigation insights.
What I Did
- Defined the business objective, metric targets, and analysis scope.
- Built and validated the data, modeling, and reporting workflow.
- Packaged outputs for stakeholder interpretation and decision support.
Results/Impact
Delivered an analysis workflow with decision-ready outputs and reusable artifacts.
Tech Stack
- Capacity Planning, Operations Research, Optimization, PowerBI, Python, Risk Modeling, SimPy, Supply Chain Analytics
Deliverables
- Project brief: (add file)
- Slides/report: (add file)
- Dashboard/model file: (add file)
- SQL/notebook/code bundle: (add file)
Project Notes
Description: Built a discrete-event simulation of a fulfillment center in Python using SimPy to model order flow, queues, utilization, SLA breaches, and WIP under normal and Prime Day-level demand. Implemented minute-level observability, real-time alert detection, station-level pressure scoring, and a multi-factor operational risk model. Ran an exhaustive staffing grid search to identify the minimum headcount required to reduce risk below target thresholds, then surfaced results through a 4-page Power BI dashboard for decision-ready staffing and risk mitigation insights. Skills Demonstrated: Capacity Planning, Operations Research, Optimization, PowerBI, Python, Risk Modeling, SimPy, Supply Chain Analytics Project Status: Planning
This is not a dashboard-first project.
This is a simulation-first system with dashboards layered on top.
What I Actually Built (High Level)
At its core, this project is a discrete-event simulation of a fulfillment center, written in Python using SimPy, with:
- Minute-level observability
- Real-time alert detection
- Station-level pressure modeling
- System-wide risk scoring
- Exhaustive staffing optimization via grid search
- Clean, analytics-ready outputs for BI tooling
Every chart you see in Power BI is downstream of this engine.
Simulation Architecture
Core Engine
- Framework: SimPy (event-driven simulation)
- Time Horizon: 8-hour shift (480 minutes)
- Randomness: Controlled via fixed random seed for reproducibility
- Stations Modeled:
- Pick
- Pack
- Sort
- Outbound
Each station is represented as a capacity-constrained resource with its own queue, utilization, and service time distribution.
Order Flow Model
Every order follows the same lifecycle:
- Arrival via Poisson process
- Pick
- Pack
- Sort
- Outbound
- Completion or SLA breach
Service times at each station are modeled using exponential distributions, which intentionally introduce realistic variance and queue amplification under load.
yield env.timeout(random.expovariate(1 / PICK_TIME_MIN))This is what causes bottlenecks to emerge naturally.
No hardcoding. No fake pressure.
Work-in-Process Tracking (WIP)
WIP is explicitly tracked at the system level.
- Incremented at order creation
- Decremented at order completion
- Sampled continuously
This allows the model to detect runaway accumulation, one of the earliest signs of systemic failure in real fulfillment centers.
Minute-Level Observability Layer
A dedicated observer process samples the system every minute.
This is critical.
It enables:
- SLA drift visualization
- Time-based alerting
- Event reconstruction
- Power BI time series without post-hoc estimation
Sampled Metrics
Per minute:
- WIP
- Orders completed
- SLA breaches
- SLA breach rate
- Queue length per station
- Active workers per station
row = {
    "scenario": scenario_name,
    "minute": int(env.now),
    "wip": int(wip_state["wip"]),
    "orders_completed": completed,
    "sla_breaches": breaches,
    "sla_breach_rate": breach_rate,
}
This is the backbone of Page 1.
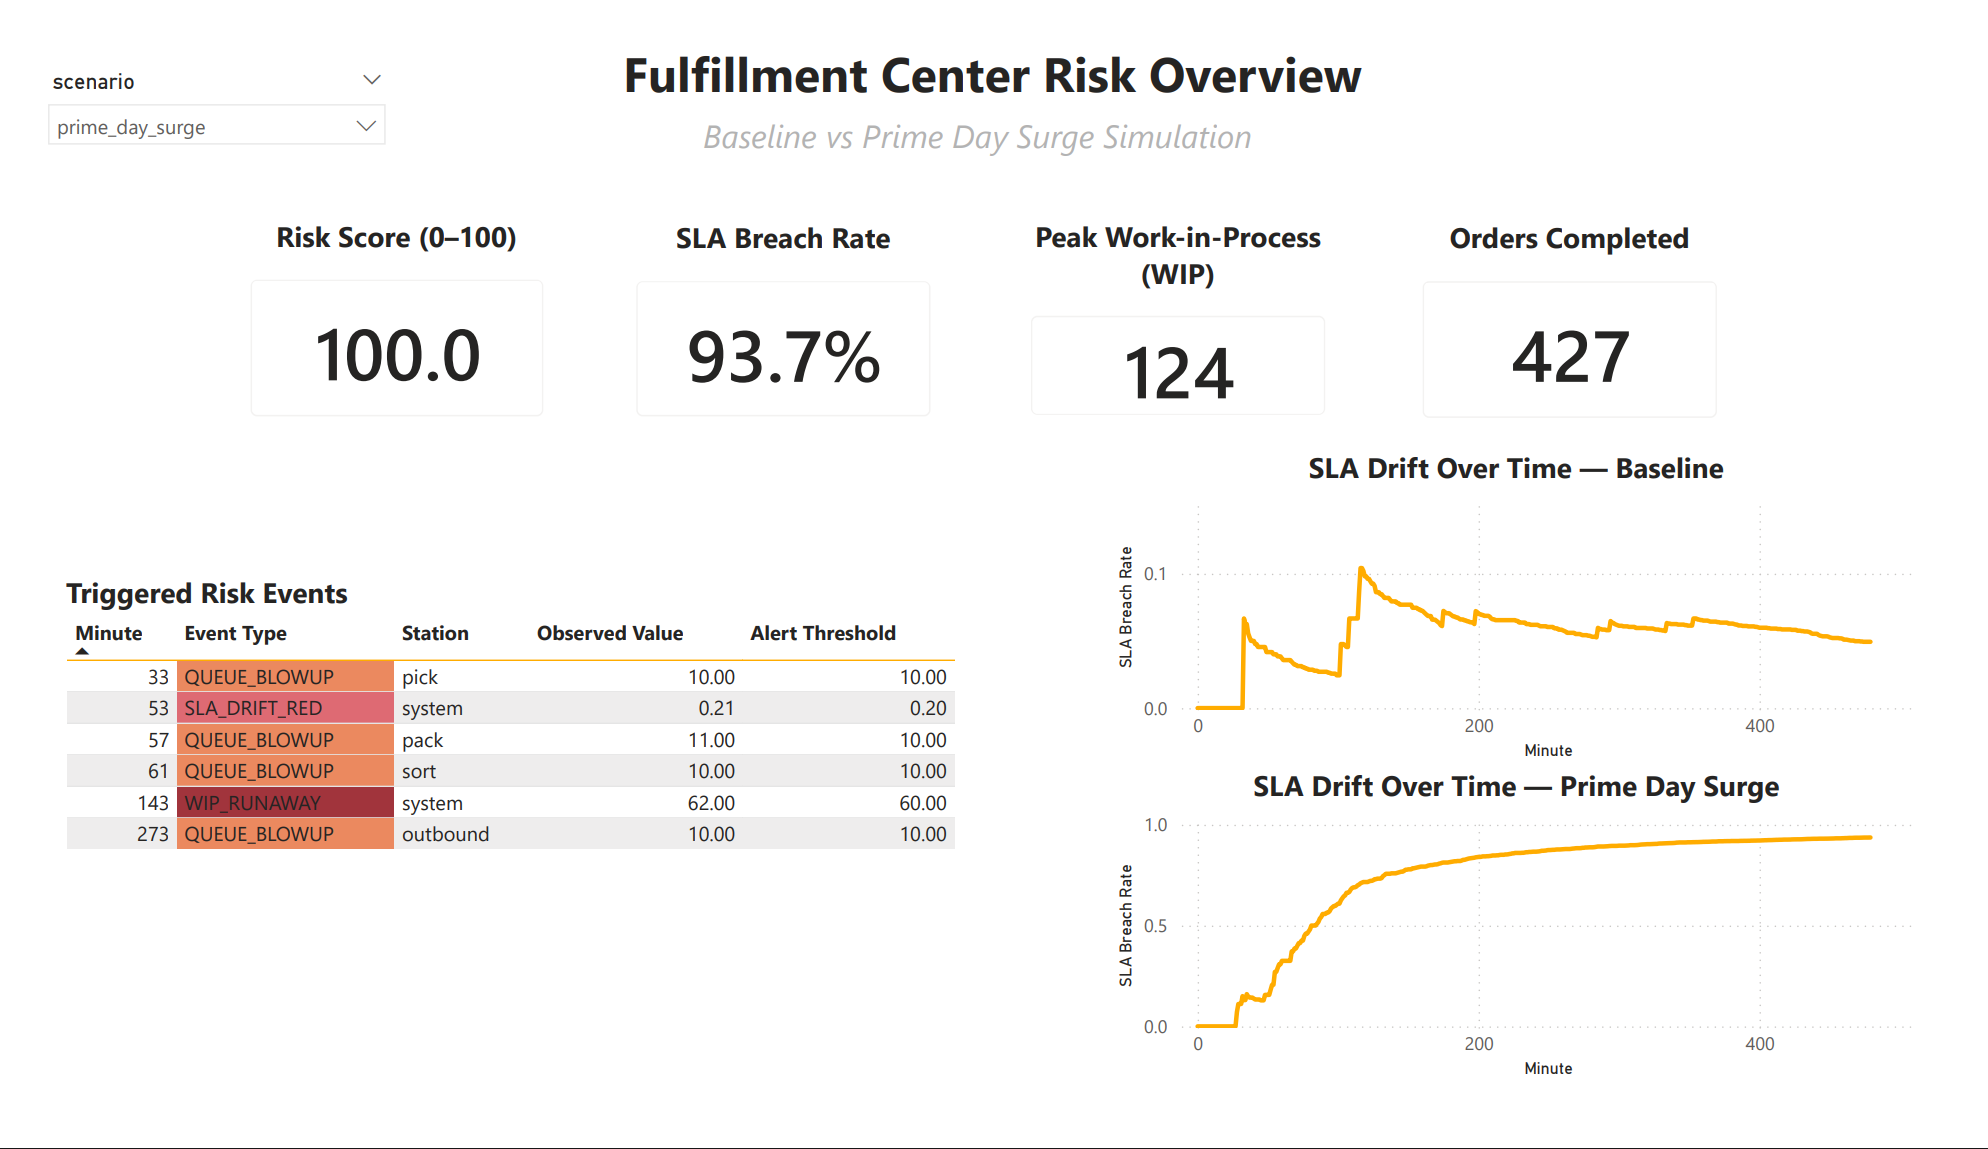
Real-Time Alerting Logic
Alerts are not post-processed.
They are triggered during the simulation.
Alert Types
- Queue Blowup
- WIP Runaway
- SLA Drift Red
Each alert fires once per scenario to avoid noise and alert spam.
if len(res.queue) >= ALERT_QUEUE_LEN:
    event_type = "QUEUE_BLOWUP"
This produces the Triggered Risk Events table directly.
No weird stuff. No Power BI hacks.
Station-Level Metrics Engine
Each station uses a custom StationMetrics class to track:
- Busy time
- Queue samples
- Max queue length
- Average queue length
- Queue pressure
This is event-based, not sampled blindly.
self.queue_samples.append({
    "time": env.now,
    "station": self.name,
    "queue_length": len(resource.queue)
})
This allows utilization and queue statistics to remain accurate even under extreme congestion.

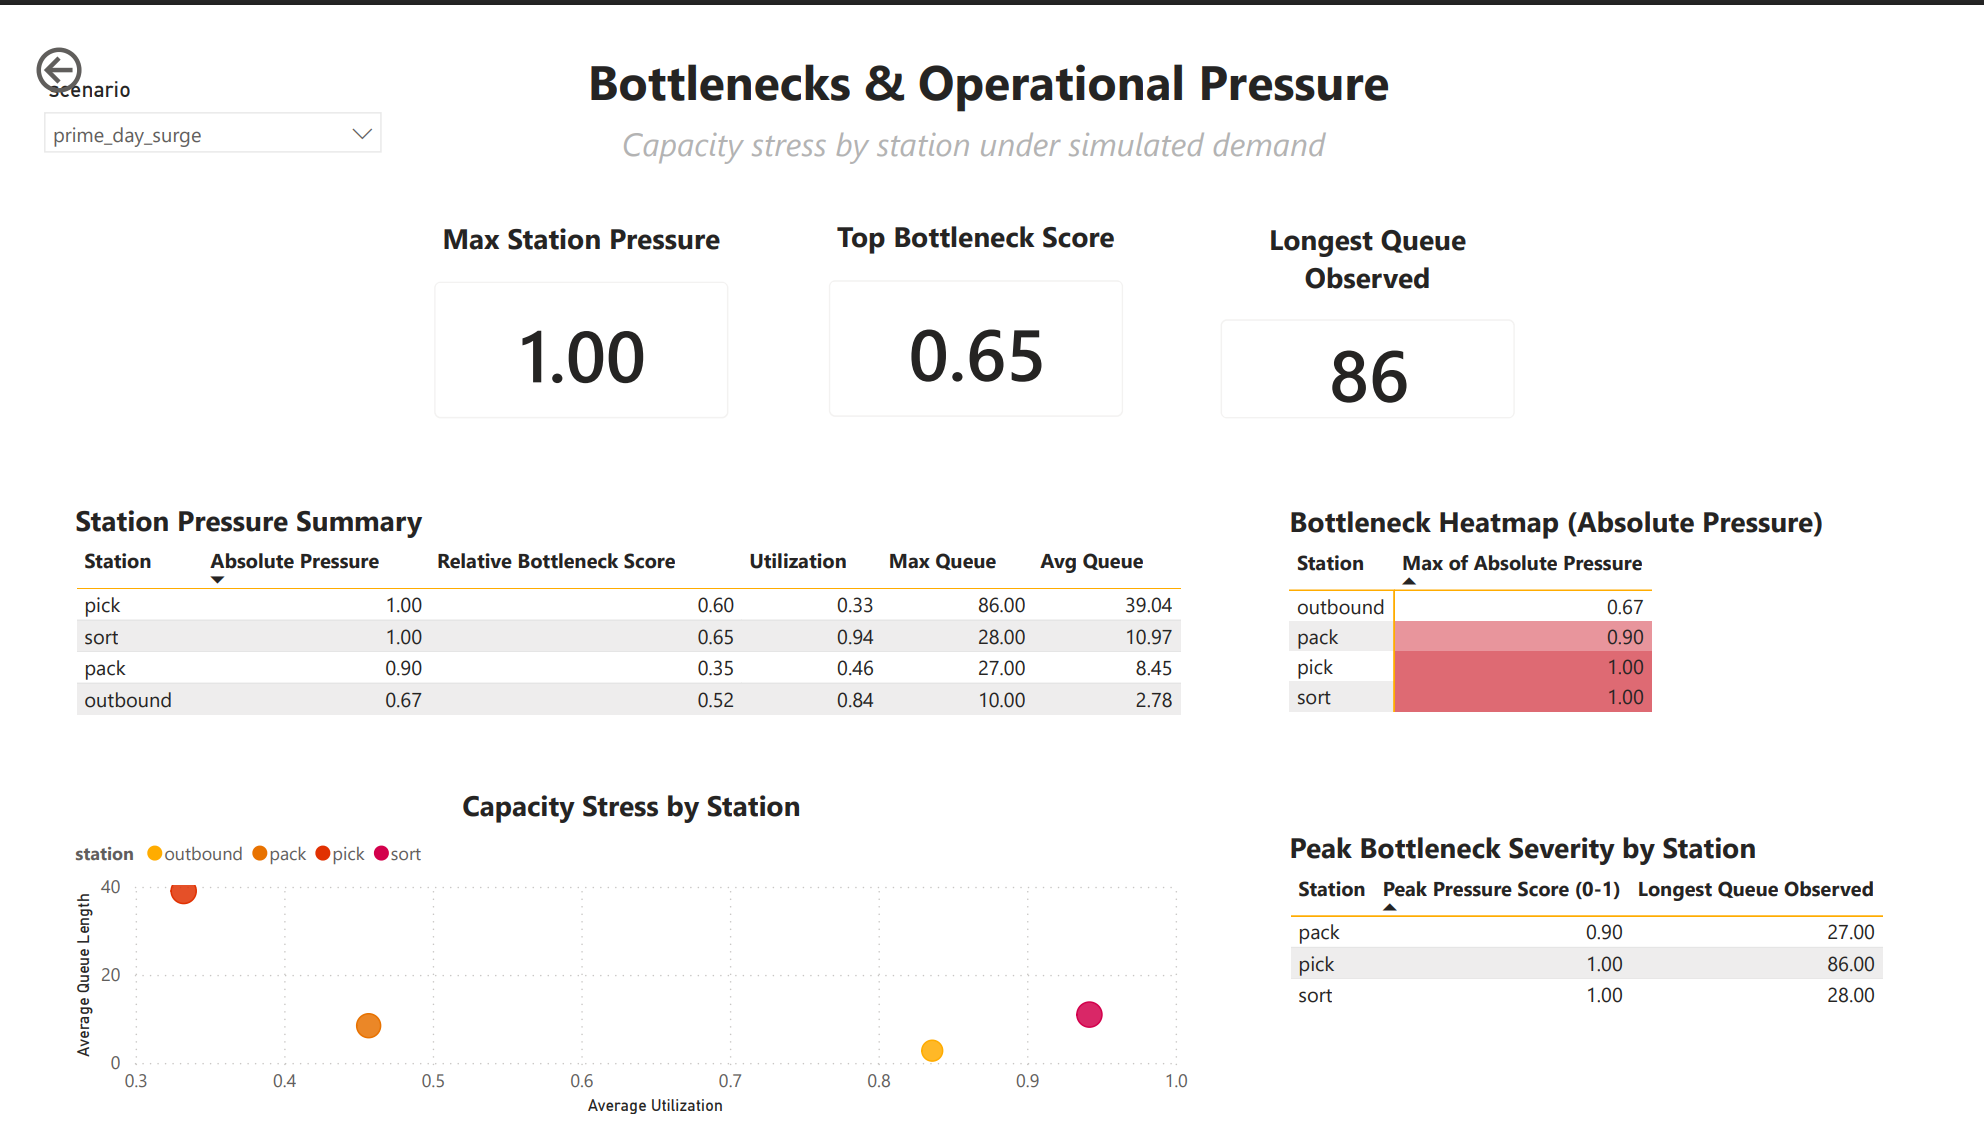
Absolute Pressure Score (0-1)
This is where the model becomes decision-grade.
For each station:
abs_pressure =
    0.5 * utilization
+ 0.5 * (max_queue / 20)- Utilization captures sustained load
- Max queue captures shock events
- Values are clipped to [0, 1]
This score drives:
- Bottleneck heatmaps
- Scatterplots
- Staffing prioritization
- Risk scoring
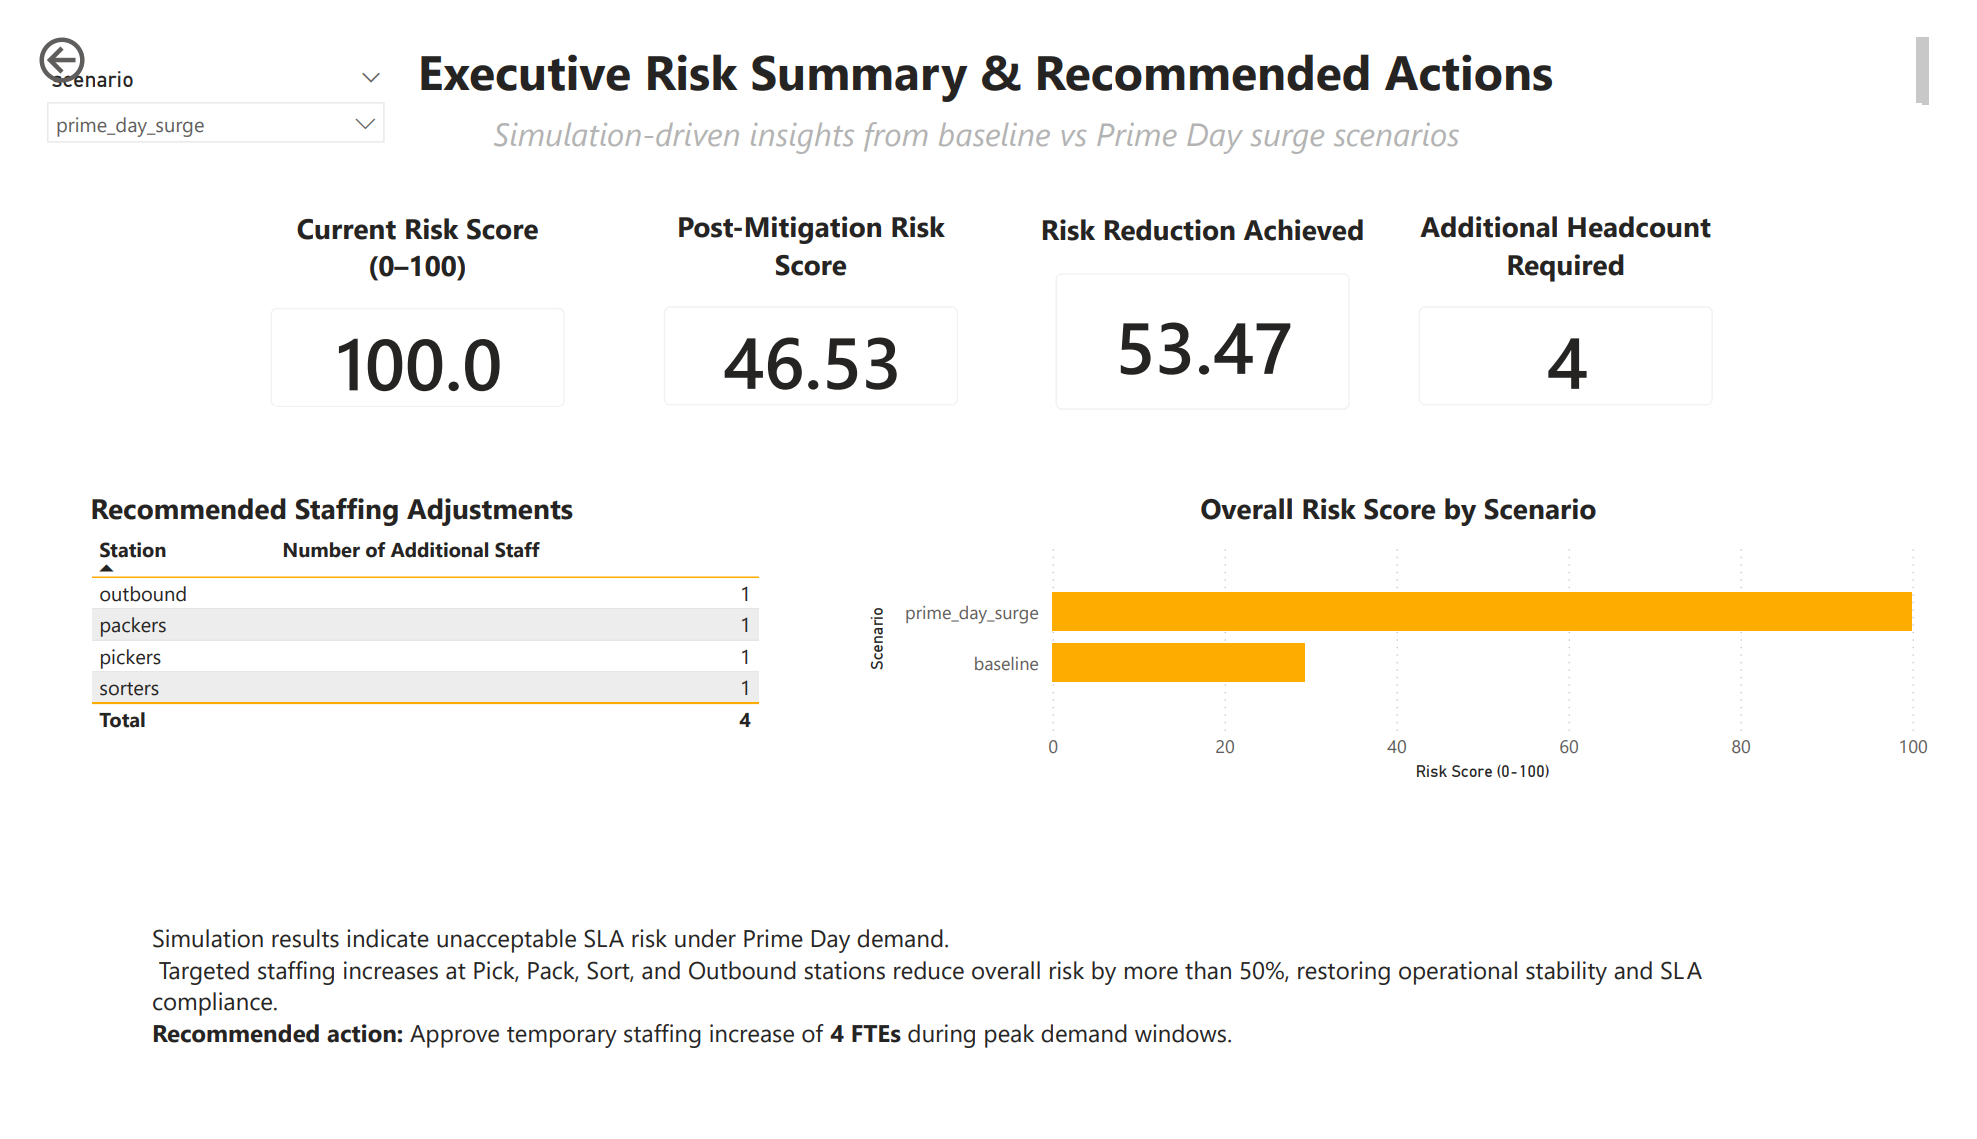
System-Wide Risk Score (0-100)
Risk is intentionally multi-factor.
risk =
    50 * min(1, sla_rate / 0.20)
  + 25 * min(1, max_wip / 50)
  + 25 * top_pressure
Why this matters:
- SLA alone does not tell the whole story
- WIP predicts collapse before SLA fully degrades
- Bottlenecks explain why risk exists
This score is what executives understand immediately.
Scenarios Executed
Baseline
- Normal arrival rate
- Default staffing
- Used to establish healthy operating envelope
Prime Day Surge
- Elevated arrival rate loaded from YAML config
- Same staffing
- Allows risk to emerge organically
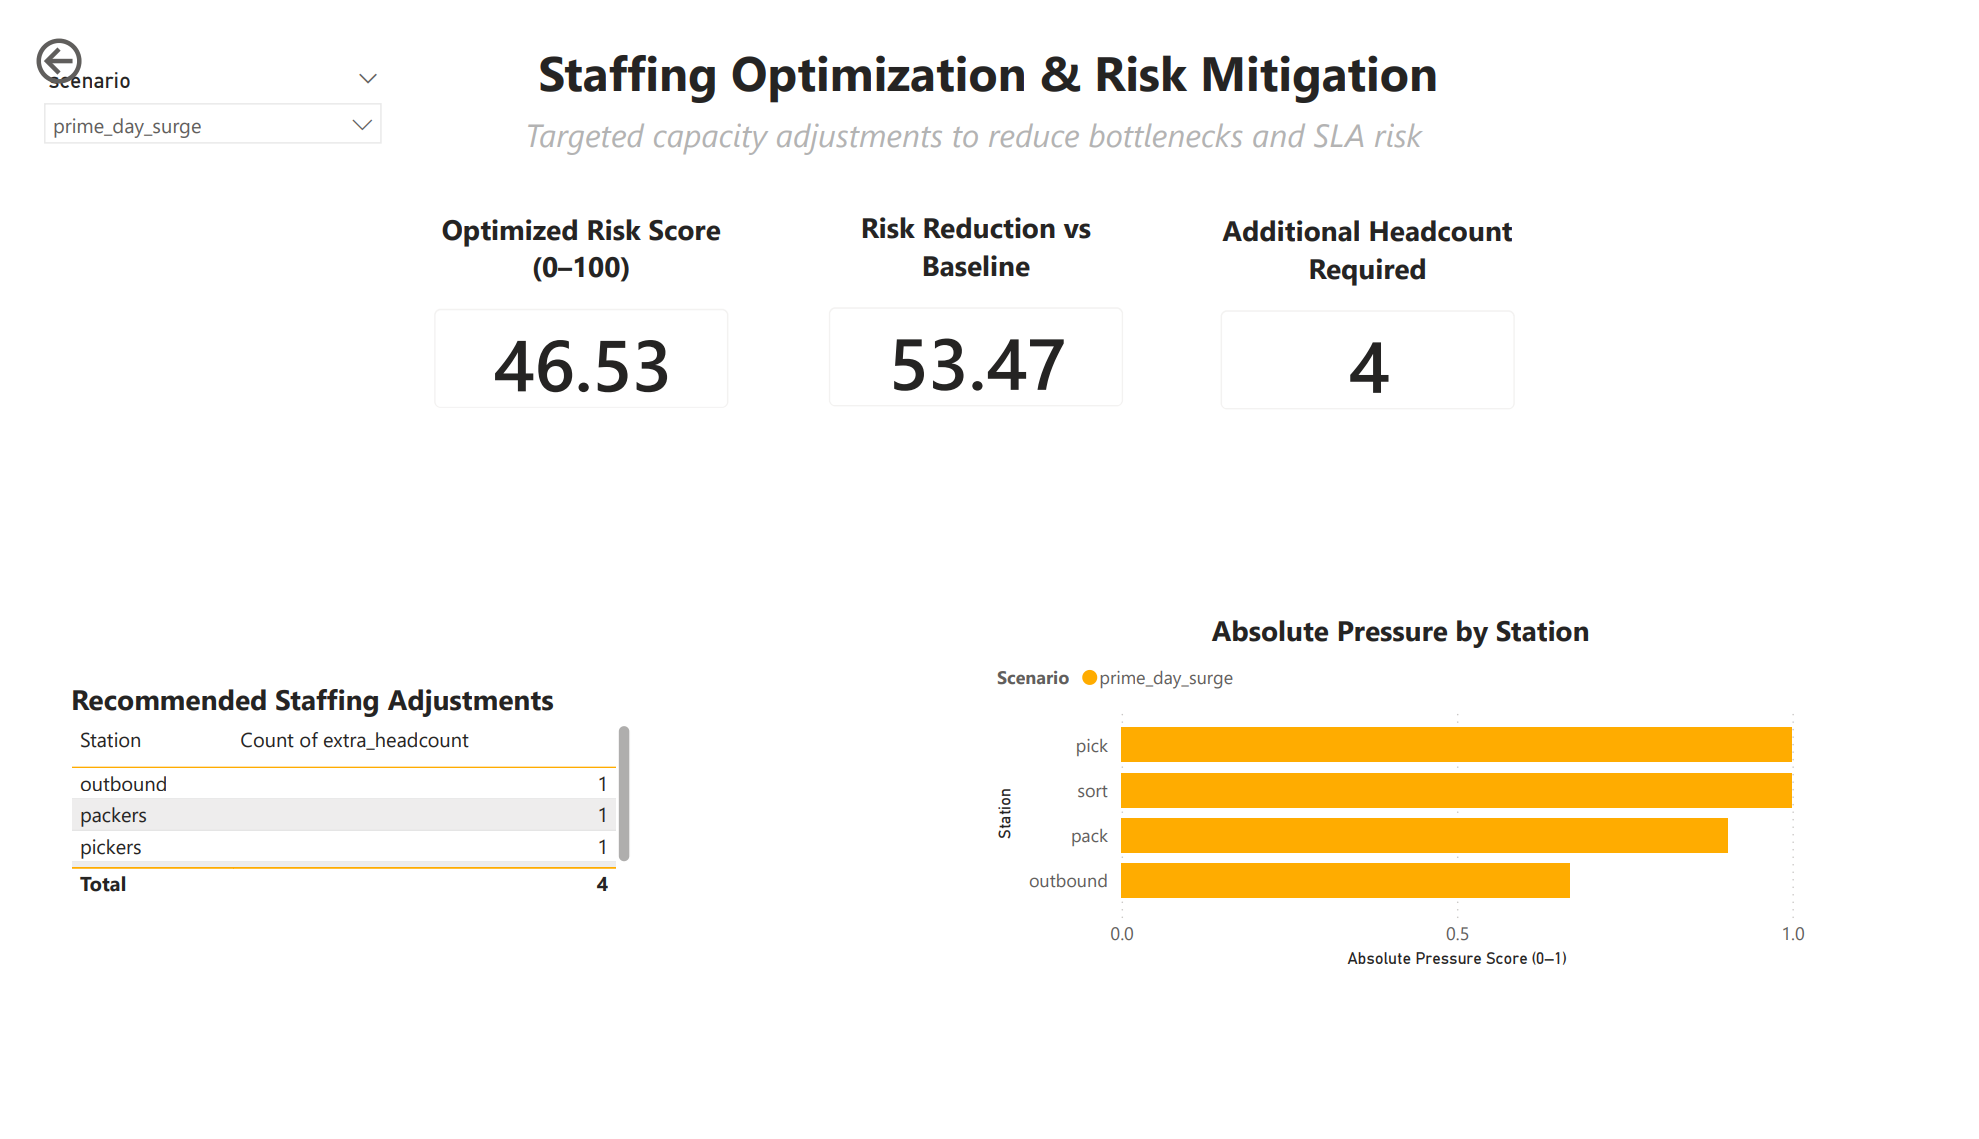
Optimized Staffing (Grid Search)
This is the killer feature.
Staffing Optimization Engine
I ran a bounded grid search over staffing combinations.
- Up to 6 extra headcount
- Distributed across all stations
- Thousands of simulated scenarios
- Each evaluated with the same risk model
for dp in range(MAX_EXTRA_HEADCOUNT + 1):
    for dpk in range(MAX_EXTRA_HEADCOUNT + 1):
        for ds in range(MAX_EXTRA_HEADCOUNT + 1):
            for do in range(MAX_EXTRA_HEADCOUNT + 1):
Each configuration is simulated end-to-end.
No shortcuts. No regression approximations.
Optimal Plan Selection Logic
From all simulated options, the engine selects:
- Only plans below risk threshold
- Lowest total headcount
- Lowest resulting risk score
best = feasible.sort_values(
    ["extra_headcount", "risk_score_0_100"]
).head(1)
This produces a defensible staffing recommendation, not a guess.
Output Artifacts
Every scenario writes clean CSVs:
scenario_summary.csvscenario_risk_comparison.csvminute_snapshot_<scenario>.csvrisk_events_<scenario>.csvstation_pressure_<scenario>.csvstaffing_optimization_results.csvstaffing_optimization_best.csv
These are directly consumed by Power BI.
No manual cleaning. No Excel glue.
At this point, the system produces structured, analytics-ready outputs at multiple levels: minute-level system state, station-level pressure metrics, scenario-level risk summaries, and optimization results.
The Power BI dashboards are not exploratory visuals. They are a presentation and decision layer built directly on top of these outputs to allow operators and leadership to interrogate system behavior, diagnose failure modes, and evaluate mitigation strategies without touching simulation code.
Why This Is Not a Toy Project
This system:
- Separates simulation, metrics, alerts, and optimization
- Produces reproducible results
- Scales to additional stations or policies
- Mirrors real fulfillment center failure modes
- Converts analytics into staffing decisions
This is how operations research actually looks in practice.